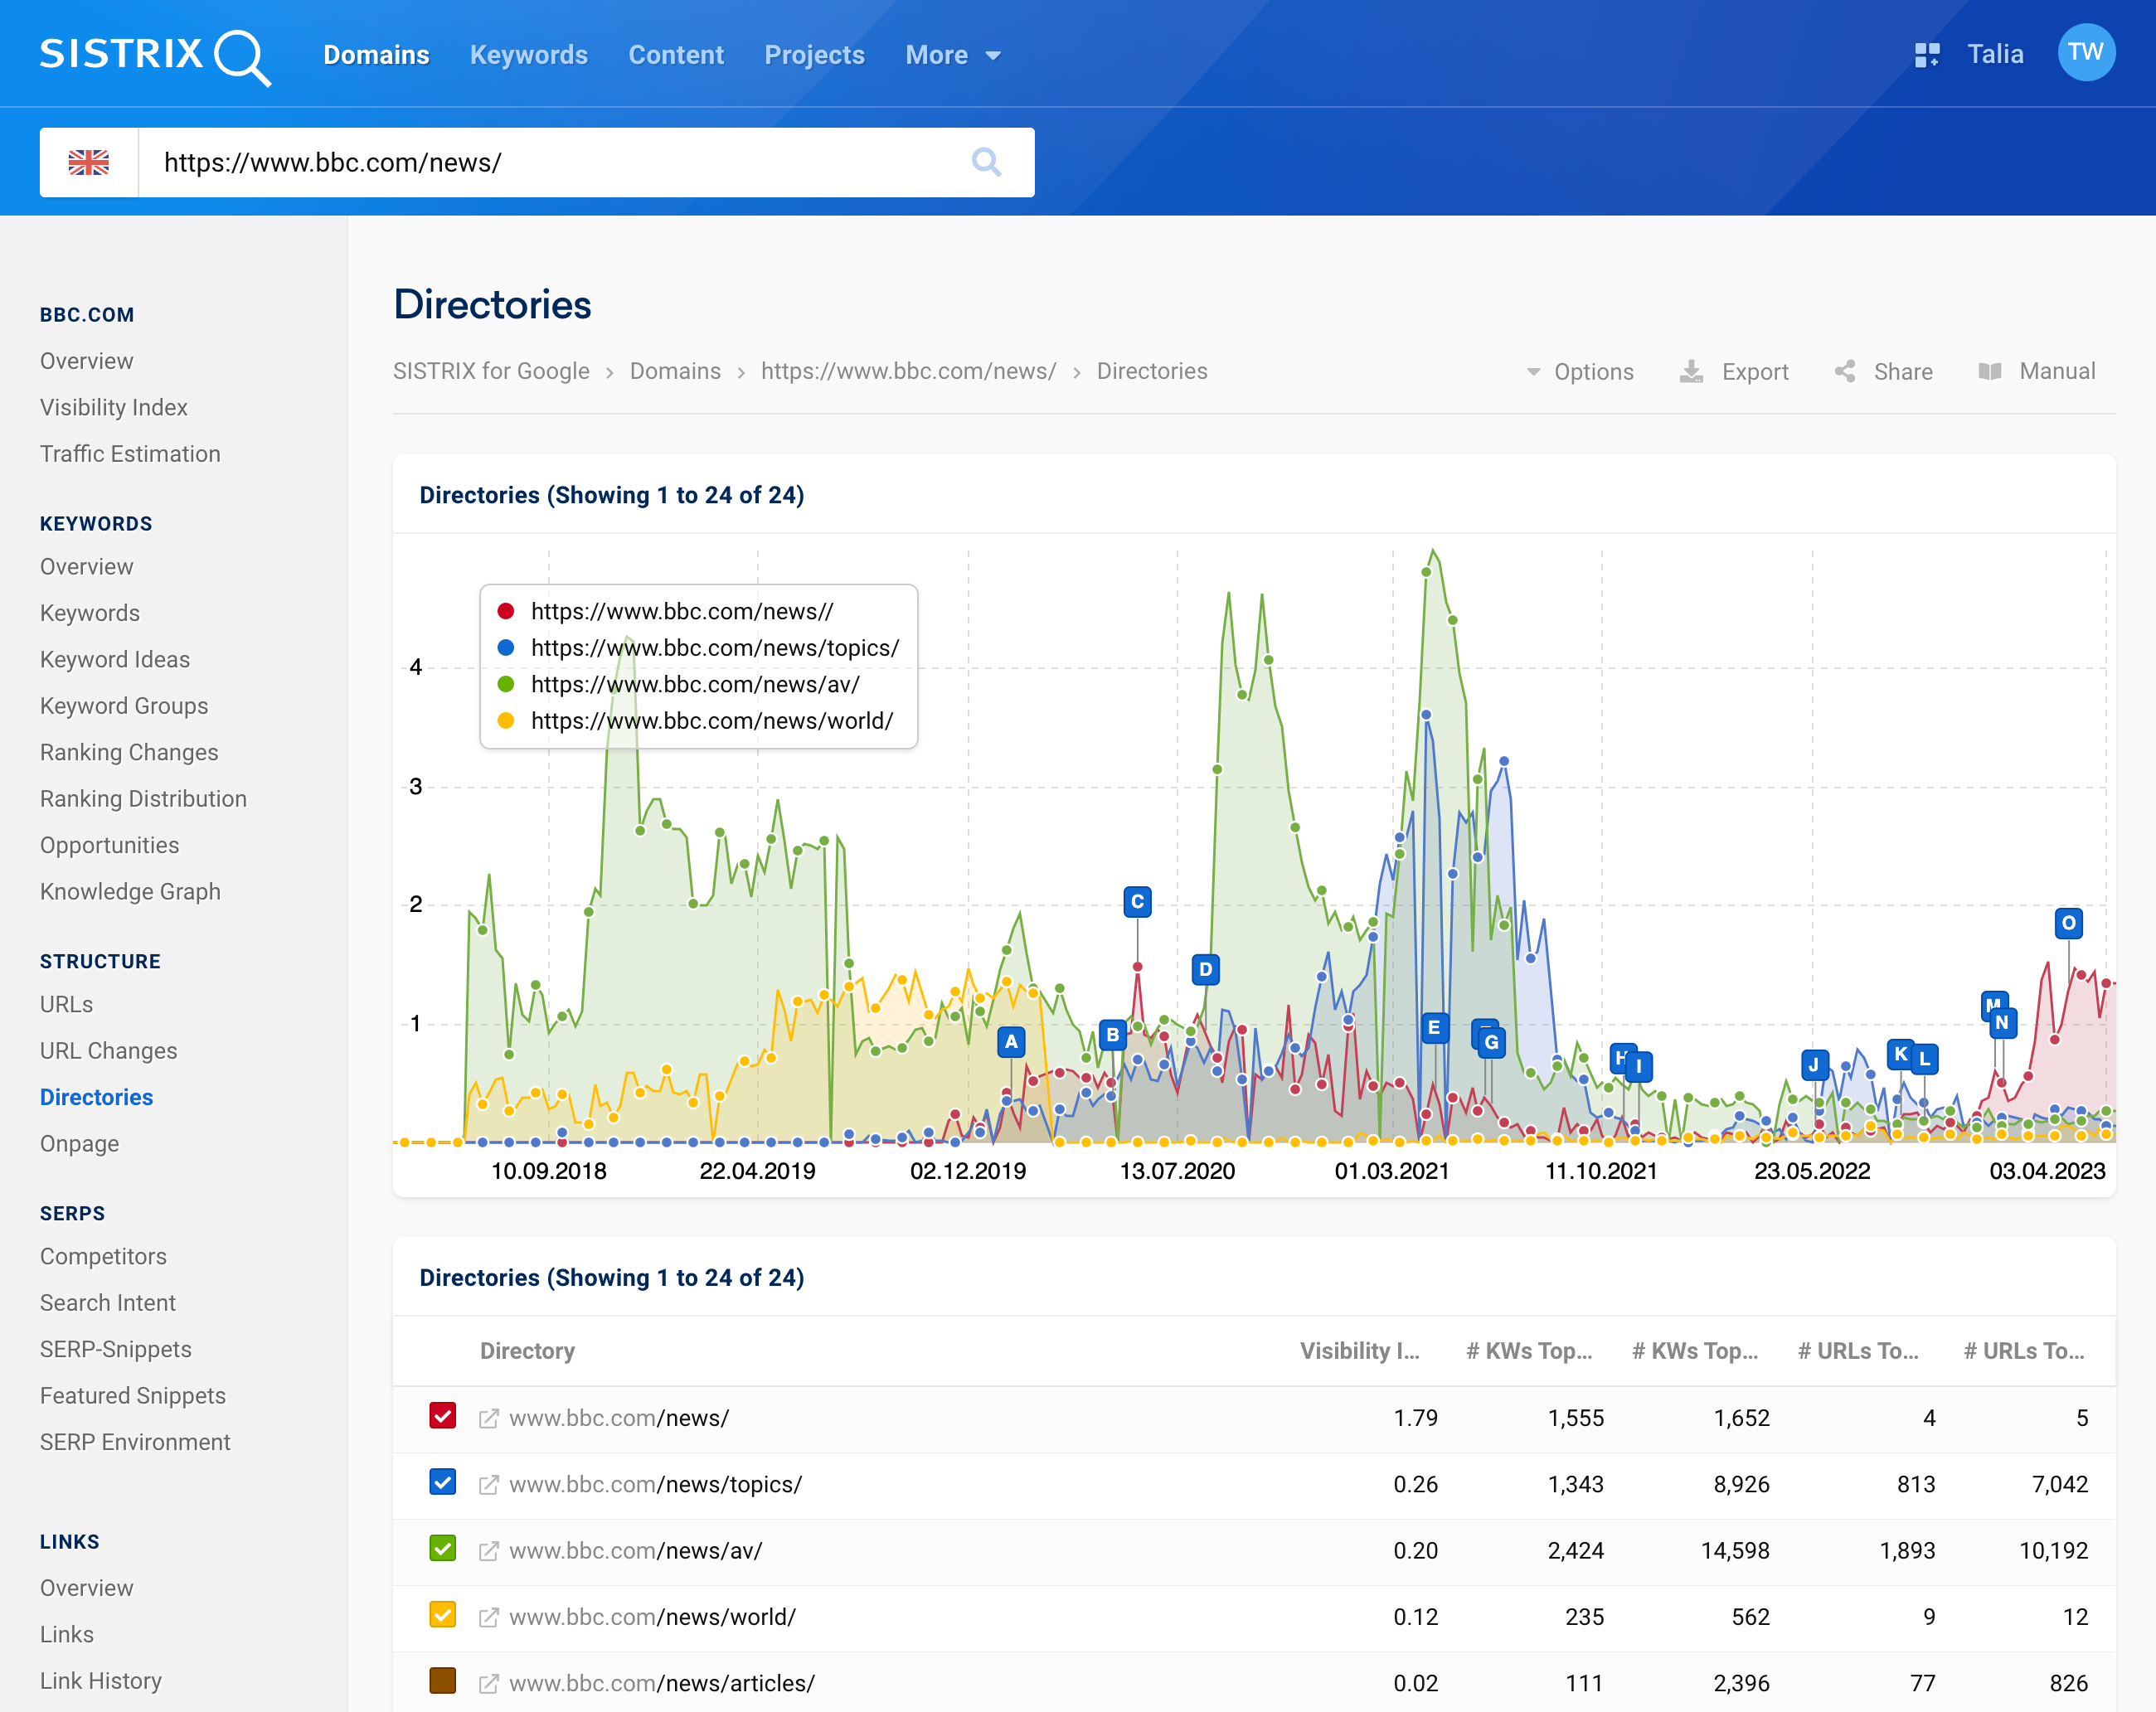
Analysing directory-level visibility can help you discover content and strategies that work in the Google Search. You can use this information to improve your website and find direct competitors.
The historical data enables a detailed analysis of a domain and can help you find directories that no longer rank. The directory data is available for all known domains.
In SISTRIX, you can analyse a directory just as you would a domain. We show you the Visibility Index and the ranking keywords for the directory, along with the complete data history.
All the features available in the domain analysis – such as the competitor analysis, ranking distribution, URL changes and ranking changes – are also available at directory level.
Where can I find the directory view for my website?
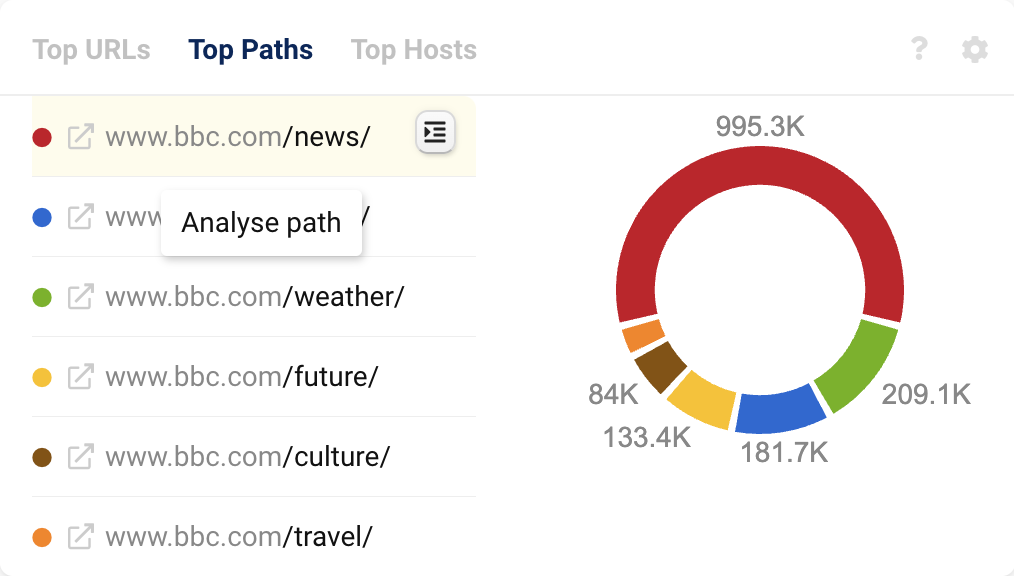
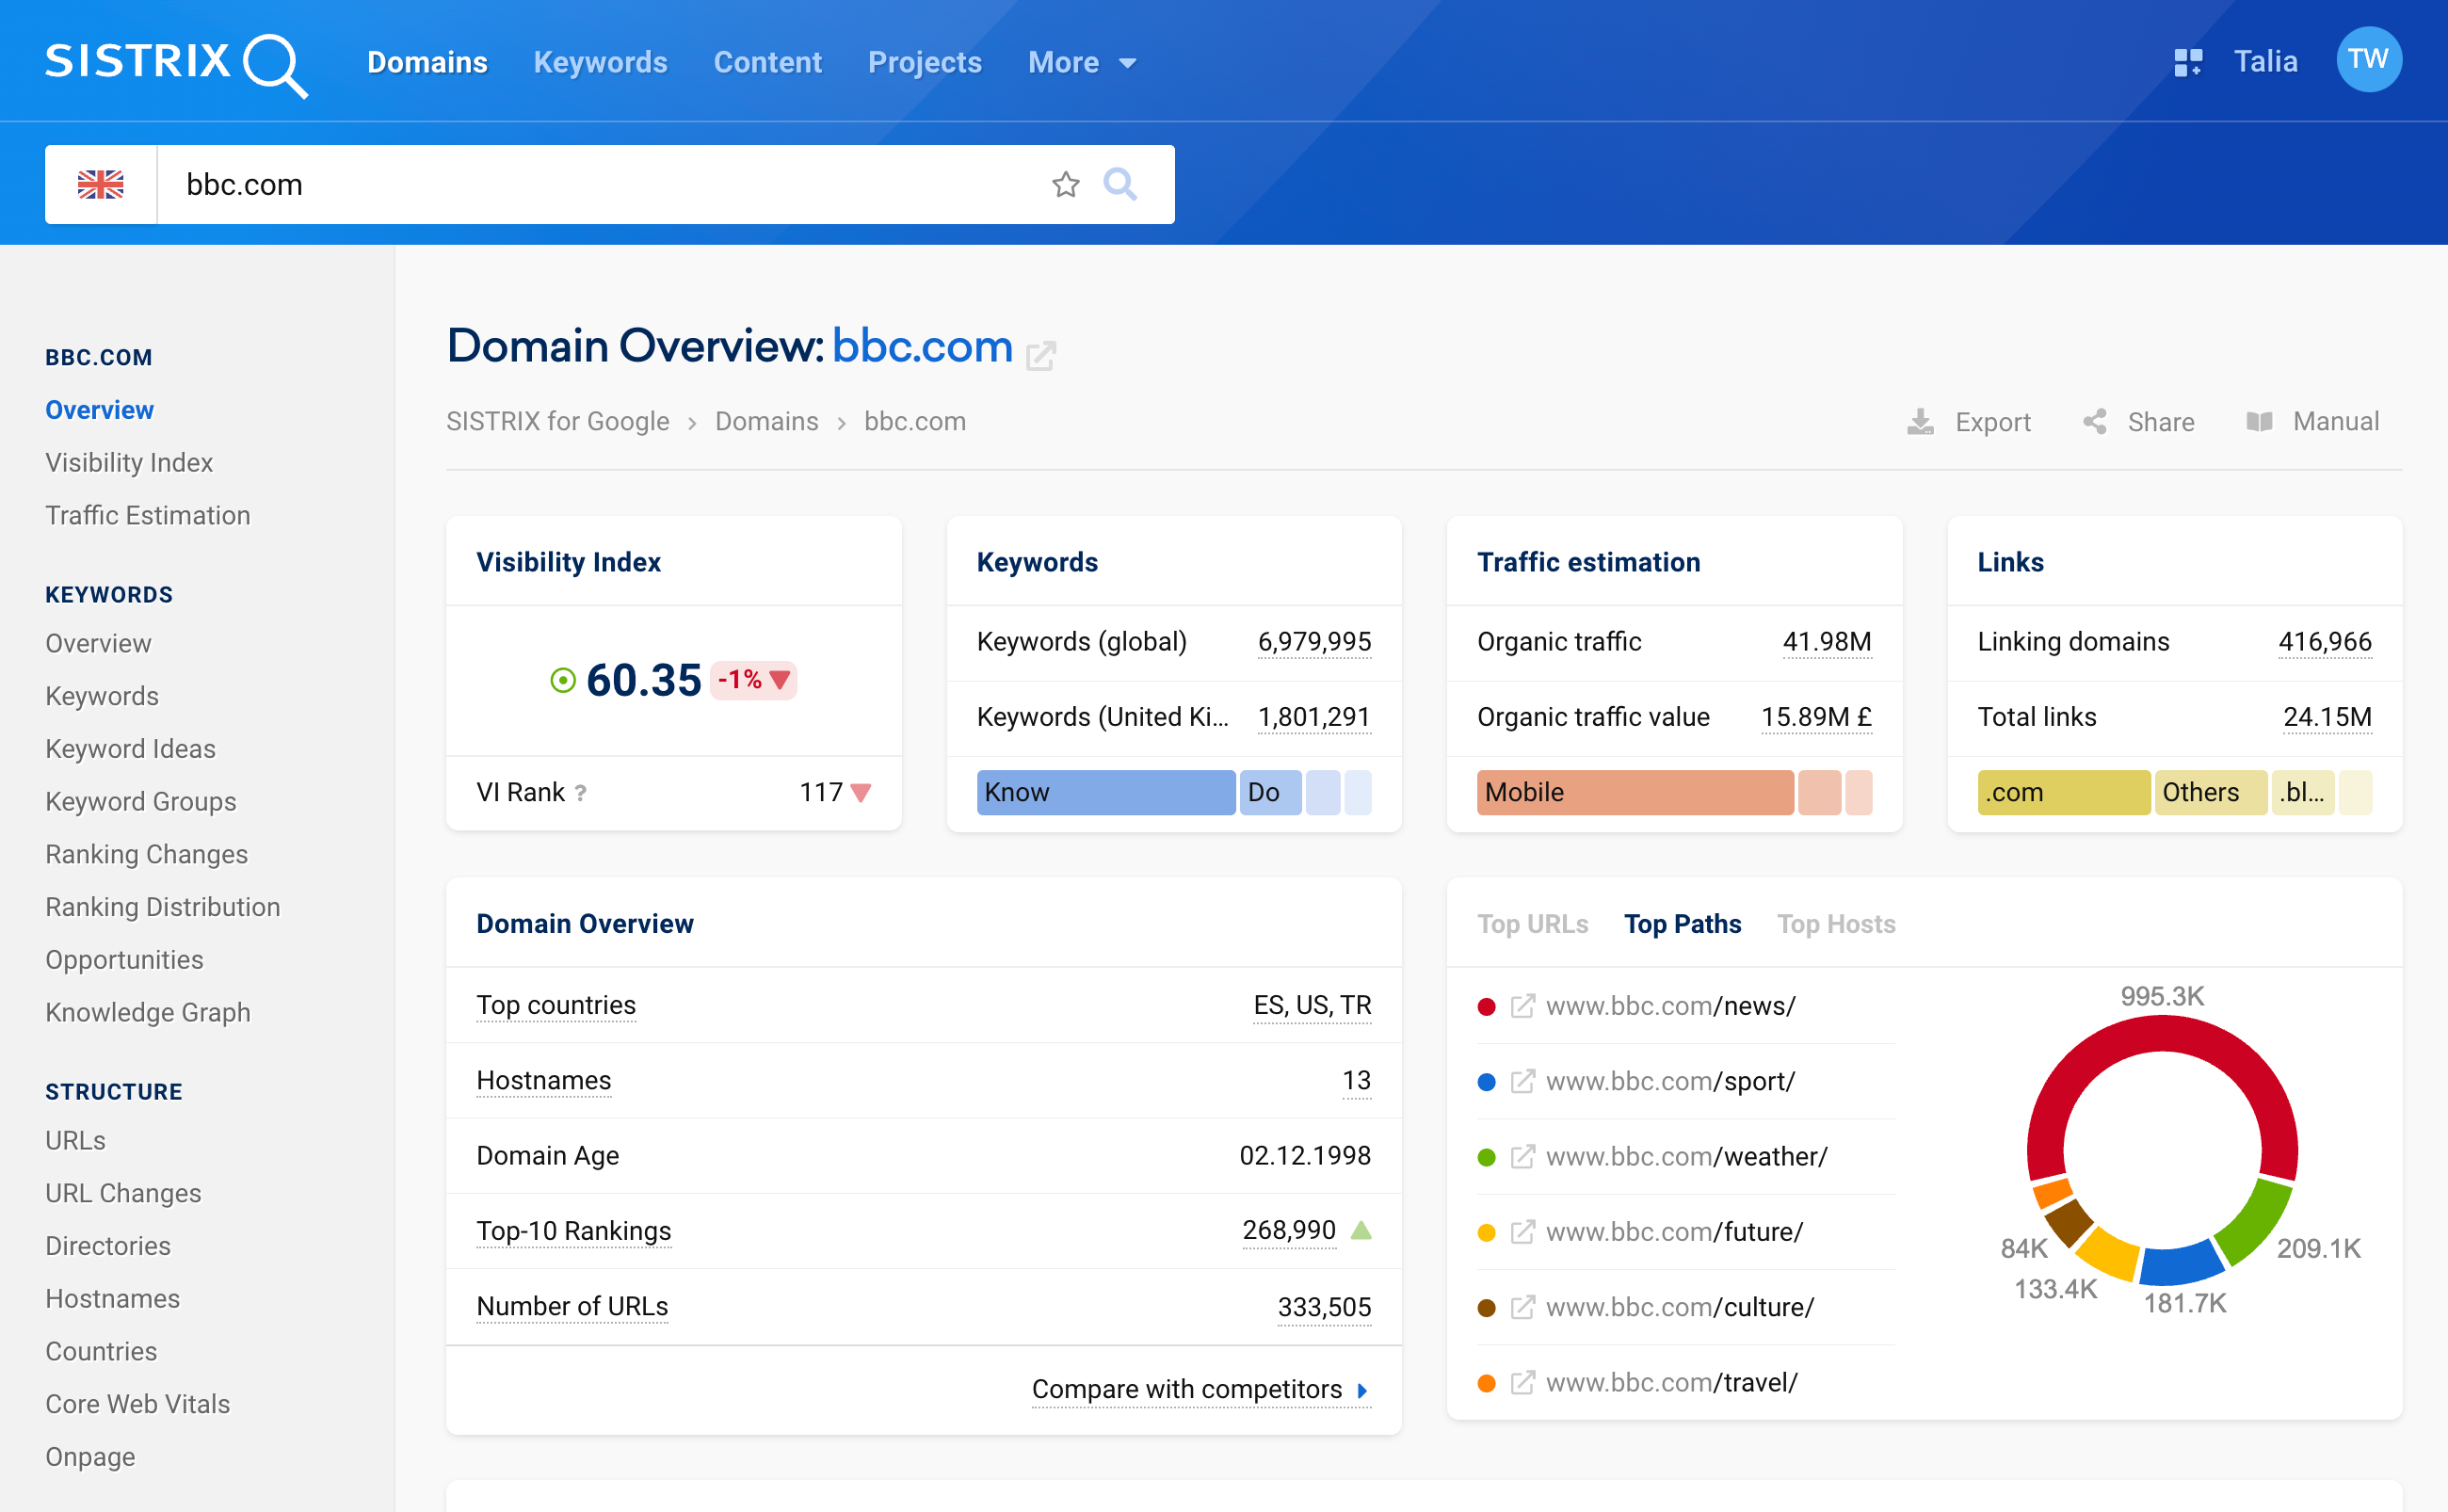
If you enter a domain into the SISTRIX search bar and take a look at the domain overview, you will find an overview of the 6 most successful directories there. These are the directories with the largest share of the total visibility of the domain.
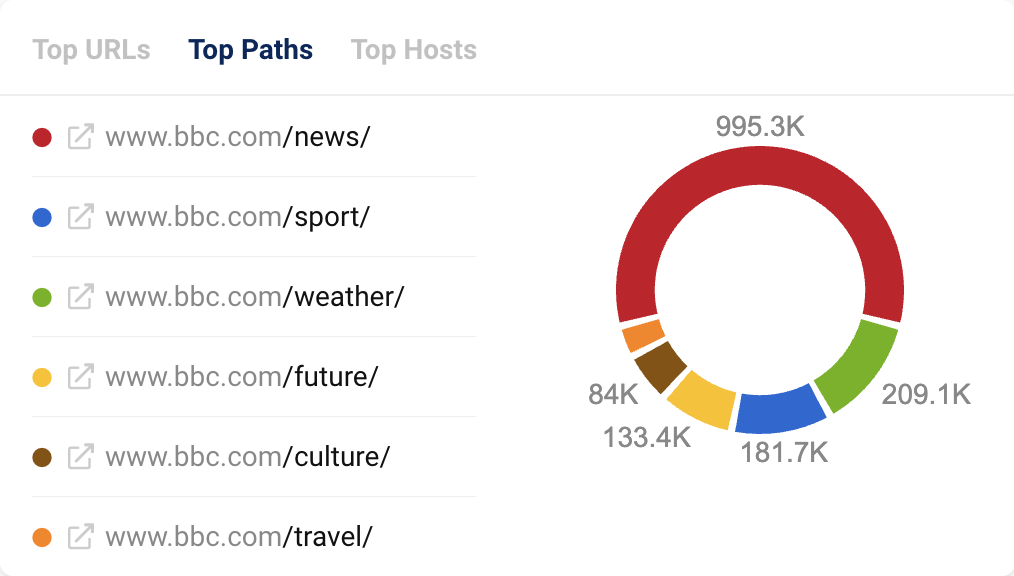
The data basis of the top directories here is our extended data.
To analyse these directories in more detail, you can click on them directly from this view.
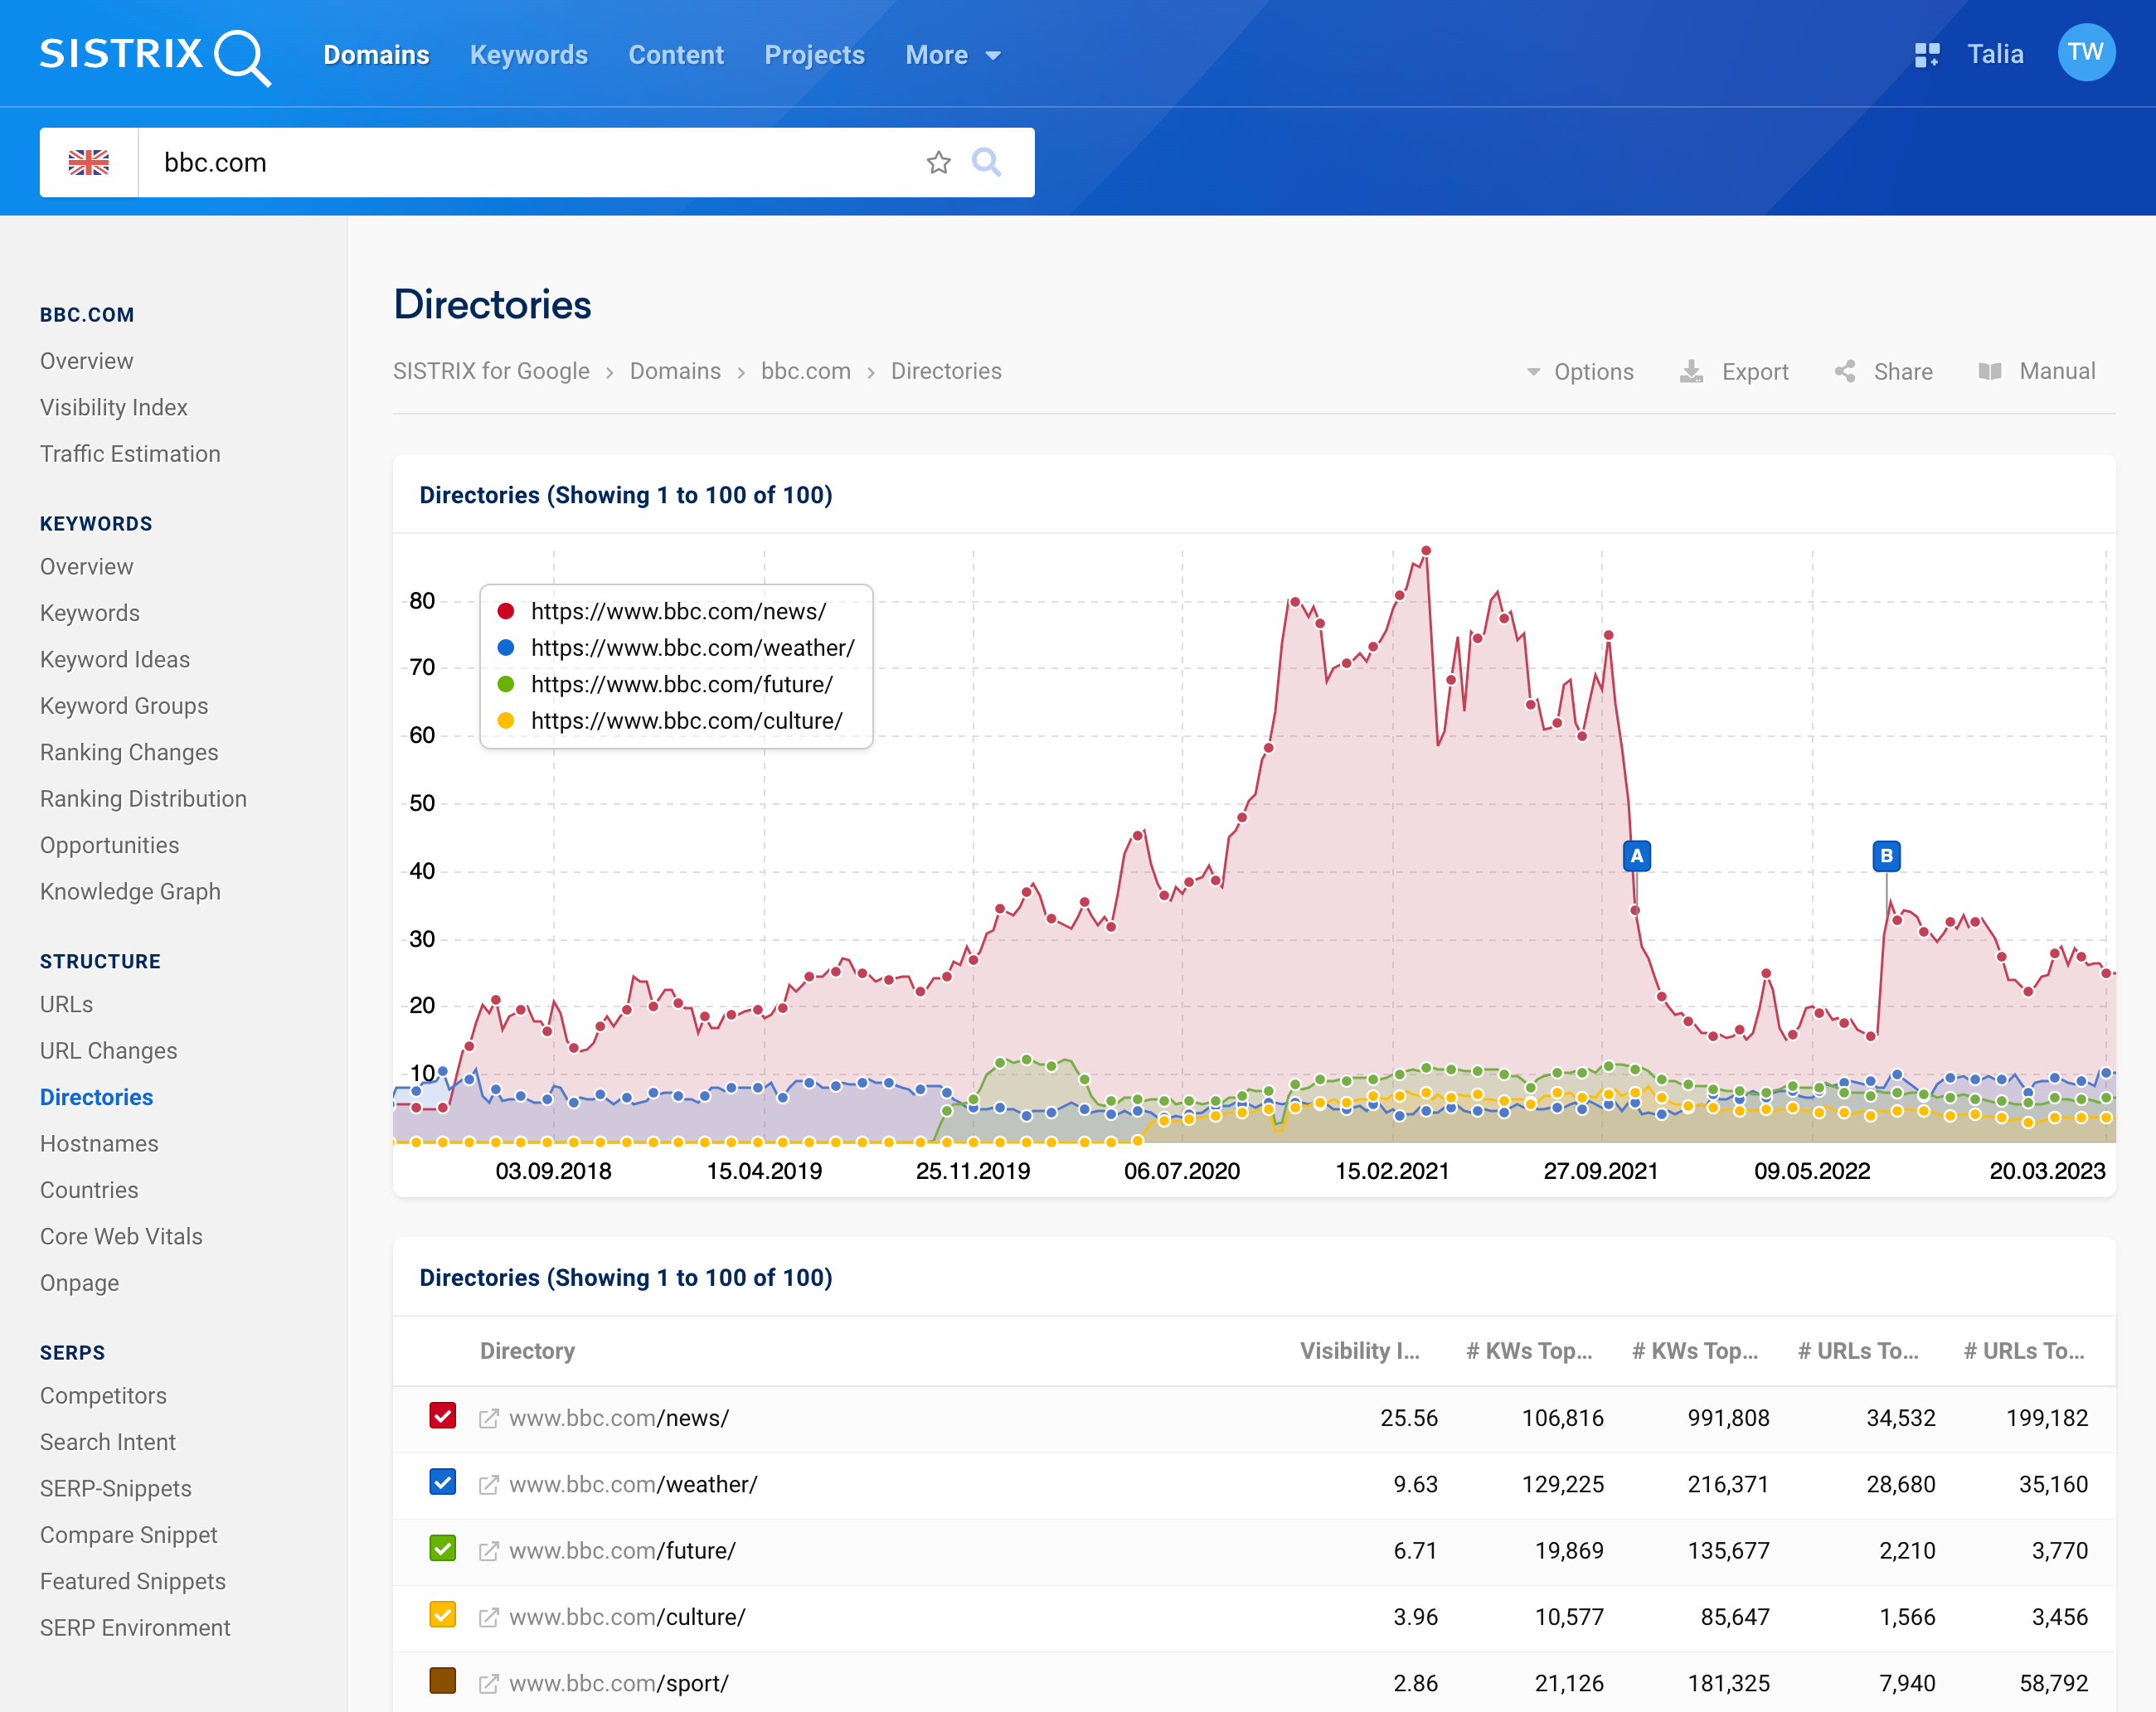
However, to get an overall view of the directories of a domain, select the item “Directories” 1 under the heading “Structure” in the navigation on the left side.
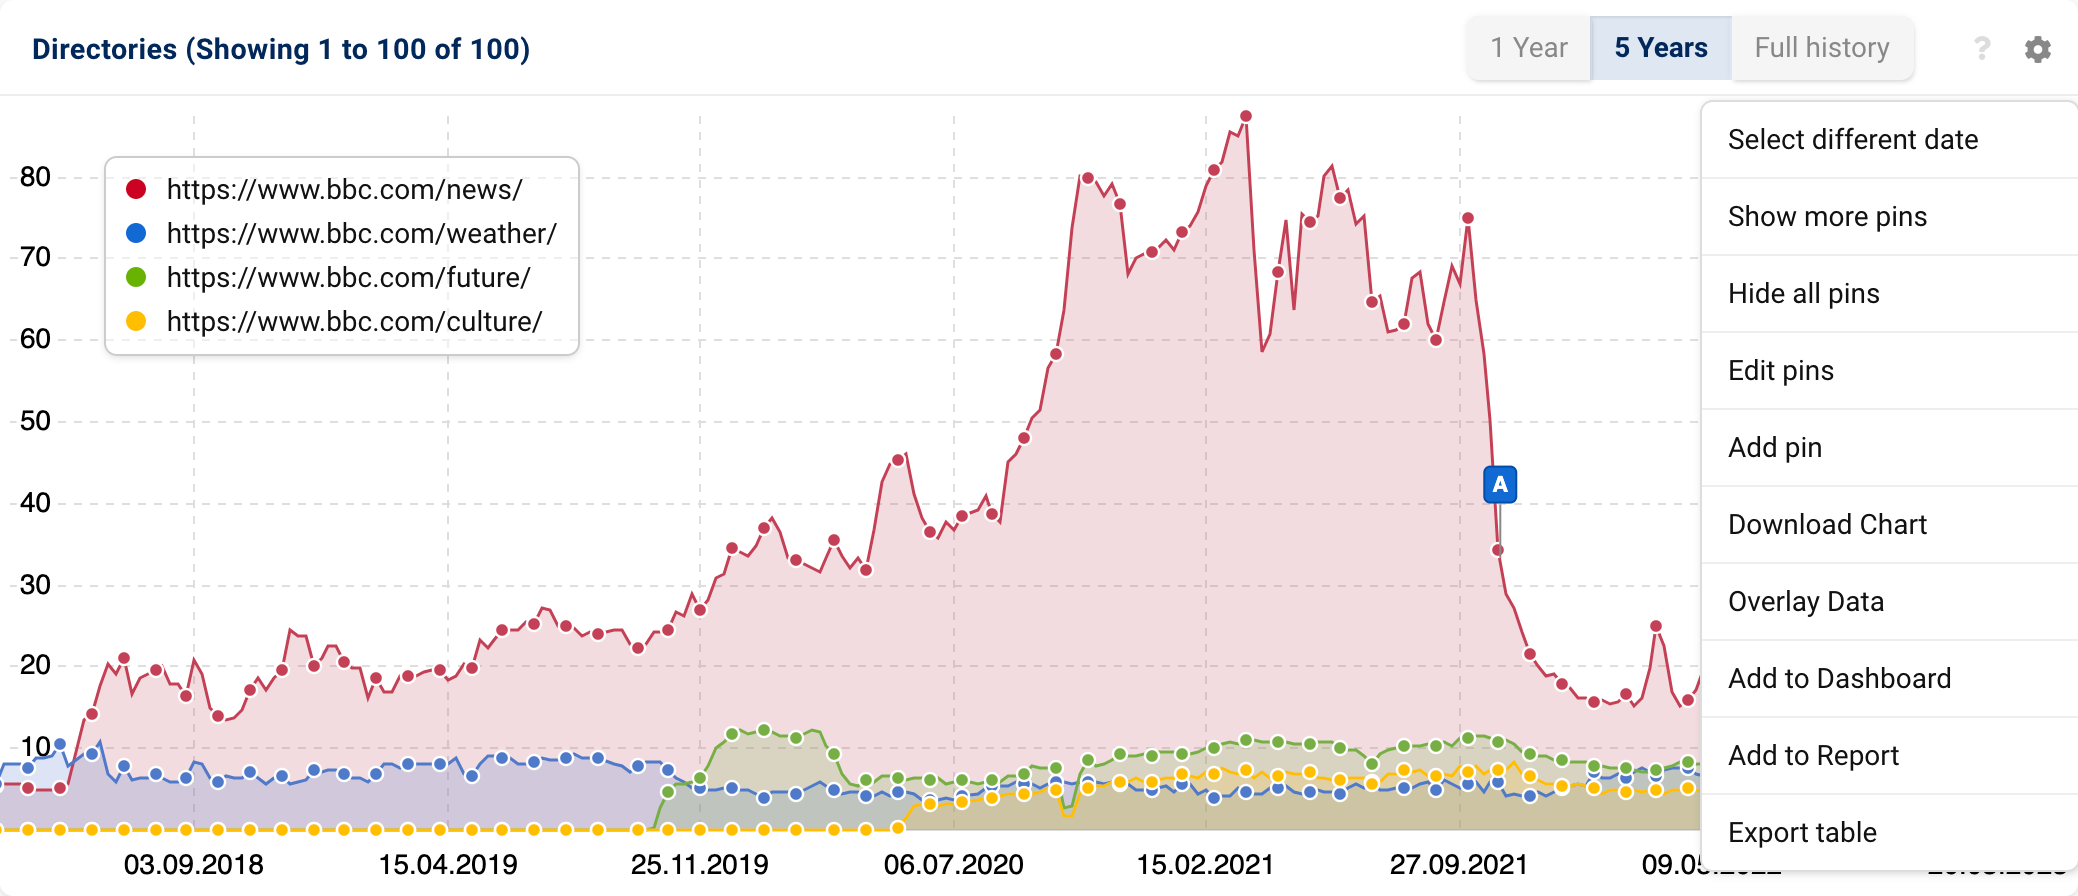
The overall view of the directories of the respective domain will open. In the Visibility graph, you will see the Visibility trends of the individual directories. By selecting or deselecting the coloured checkboxes in the table below, you can choose which trends you would like to view.
Data Customisation Options
The data displayed can be customised in various ways to suit your particular analysis goal.
In the bar at the very top, you will find the option to select the data source 1 behind the “Options” button. Here, you can choose between mobile and desktop data.
Next to that, you can find the other buttons Export, Share and Manual 2.
- Export: Export the contents of the page as a PDF file.
- Share: Create a shortlink to this page, which you can then share with people who do not have their own SISTRIX access. To do this, you will need credits.
- Manual: There is a handbook for every page in SISTRIX, where all features of a page are explained in detail.
The cogwheel icons in the top right of both data boxes on this page offer additional options. For example, you can select a different date there 1, add the data boxes to a report 2 or export the table as a CSV file 3.
We explain the individual features of the box options in more detail in the tutorial on the Domain Overview.
Example Uses of Directory-Level Visibility Data
Let’s take a look at a few examples of how directory data can help you with your SEO work.
- Use historical visibility data to get to the bottom of fast-growing or losing areas of a domain.
- Gather insights about a domain – Monitor your competitors’ areas where they publish new content, or keep an eye on new products from other manufacturers.
- Find similar directories on other domains that rank for your keywords.
- Monitor content moves across directories.
Simple directory analysis
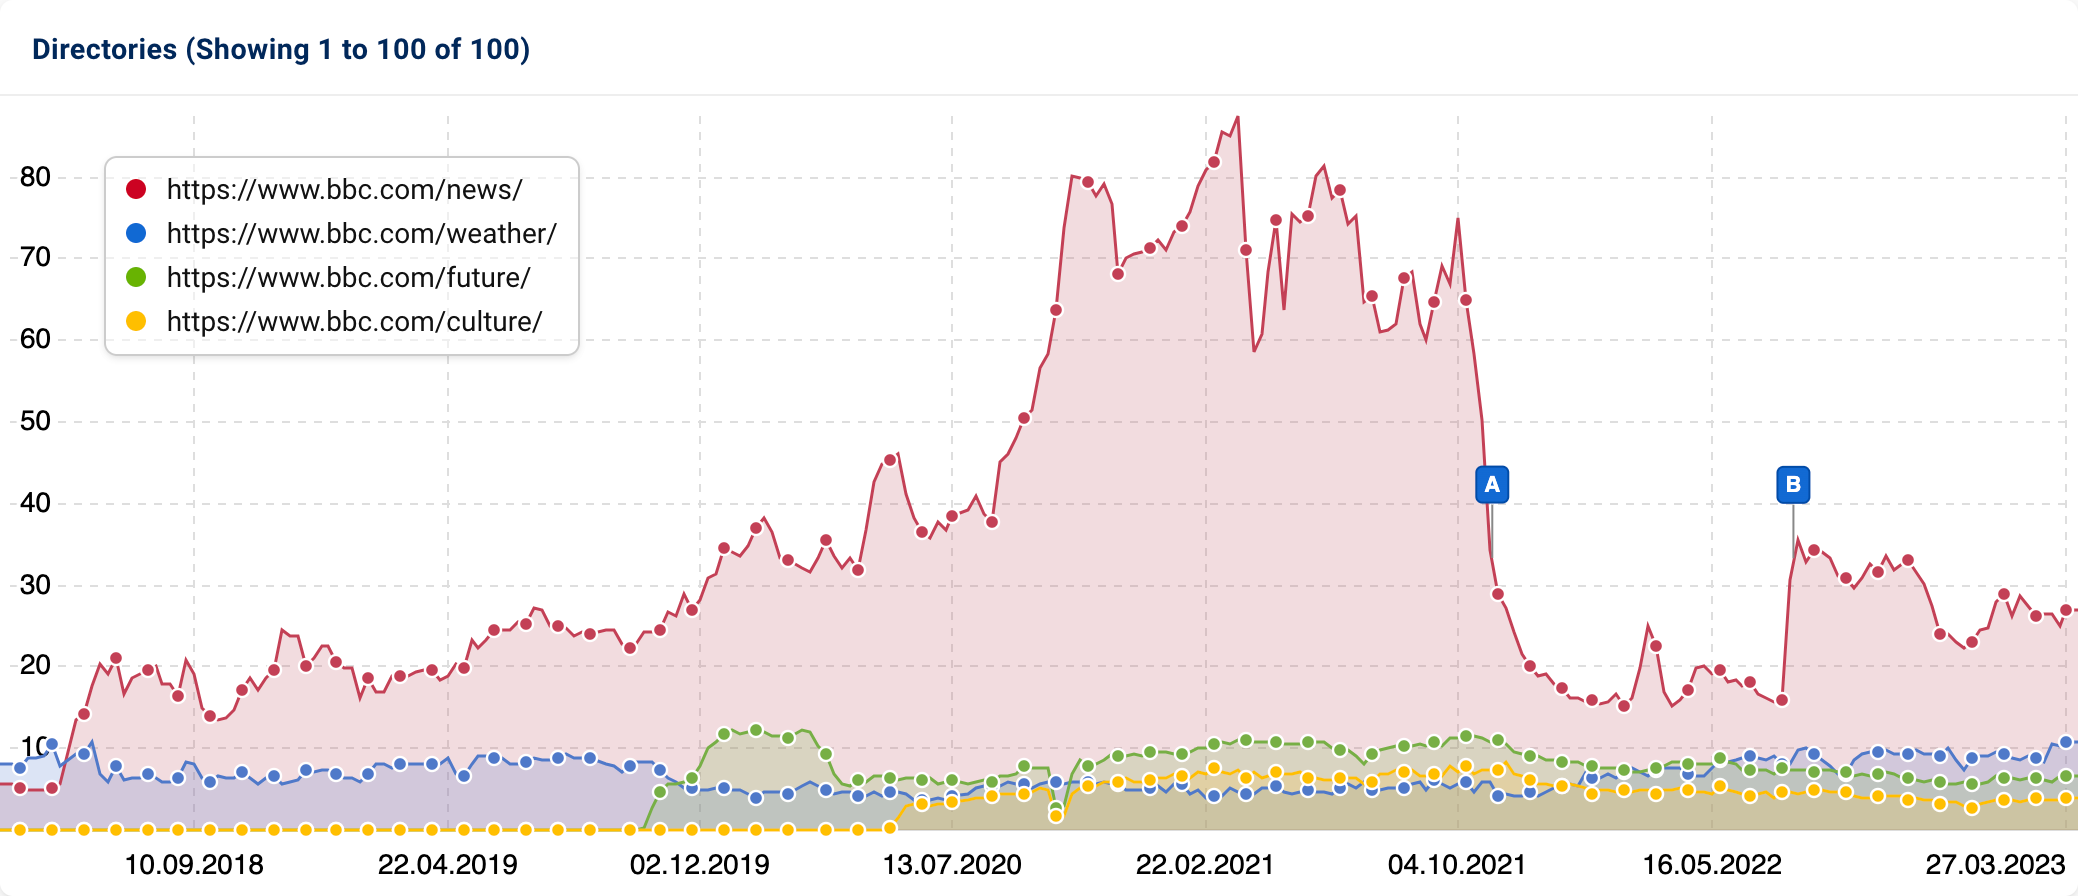
The data box on the directory page of a domain shows the visibility history of the four strongest directories on Google. The data is shown on a weekly basis and will give you the possibility to evaluate the following three main points:
- What is the visibility of each directory on Google?
- Are there any visibility problems caused by a technical issue (during a relaunch, for example)?
- How have the directories changed over time, and have there possibly been changes in the domain structure?
All these questions can be interesting not only for your own domain, but also for the domains of your competitors.
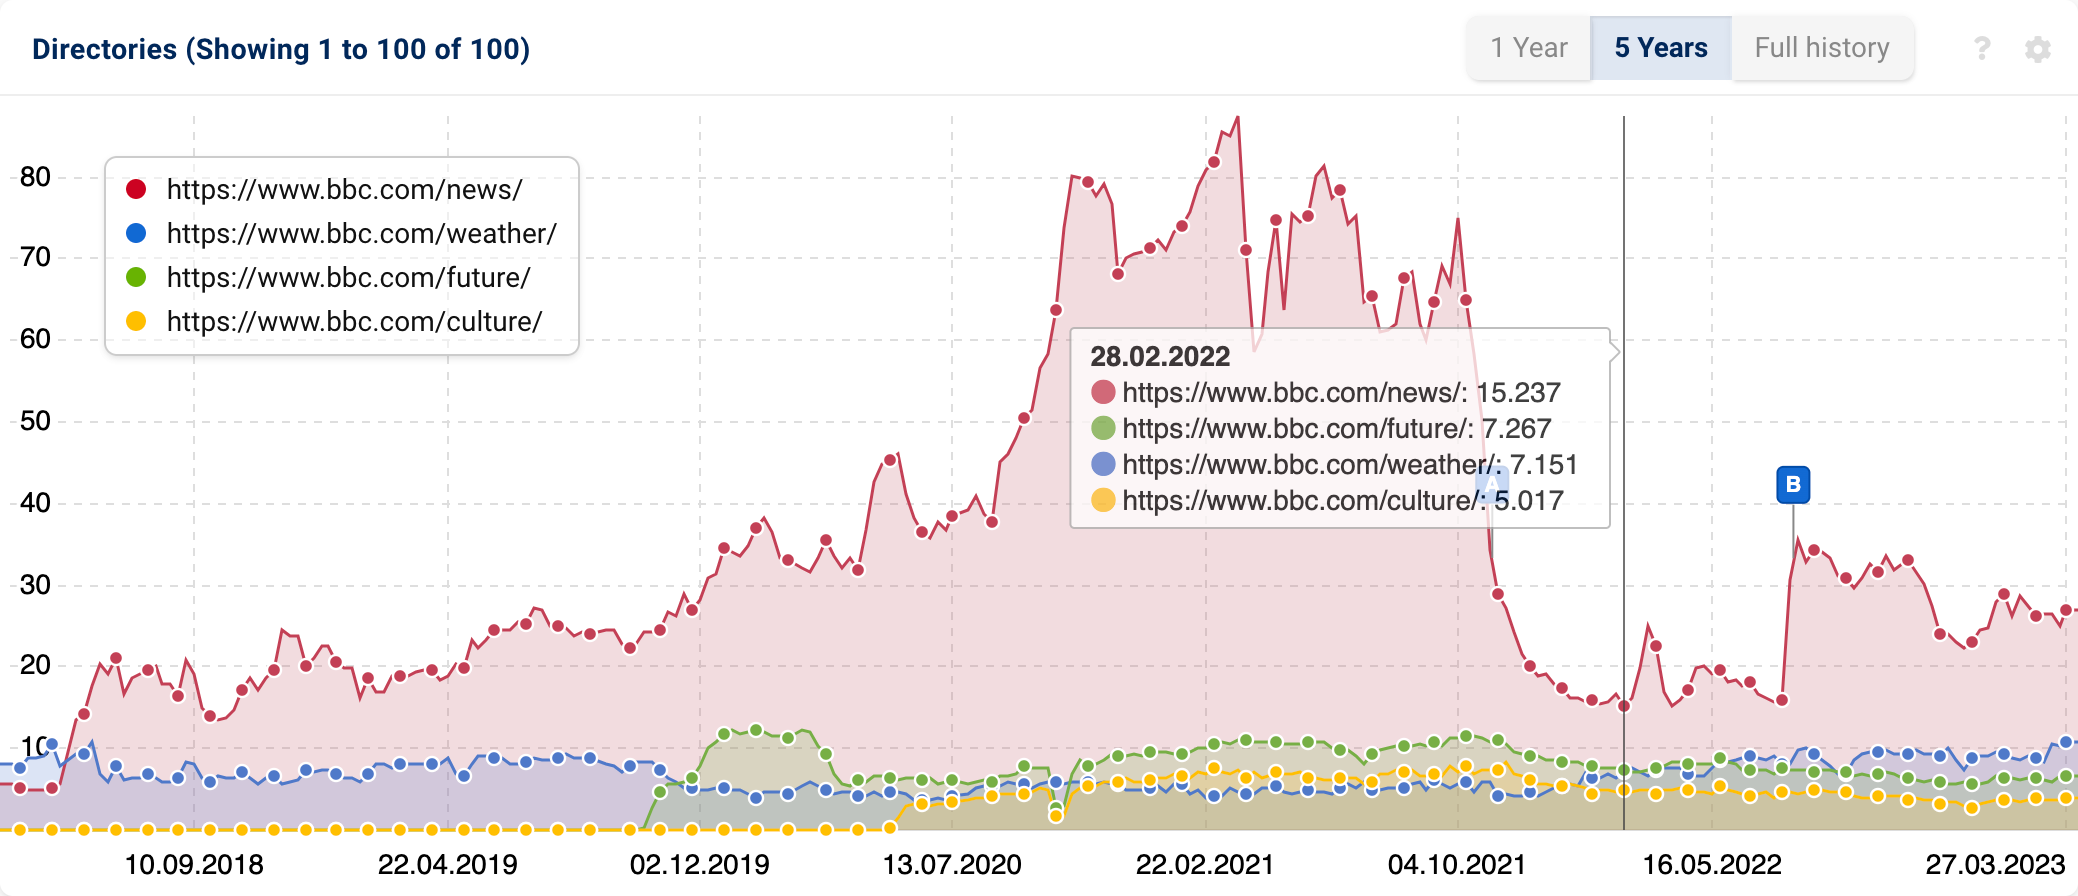
If you hover the mouse over the chart, the directory data of the selected week is displayed.
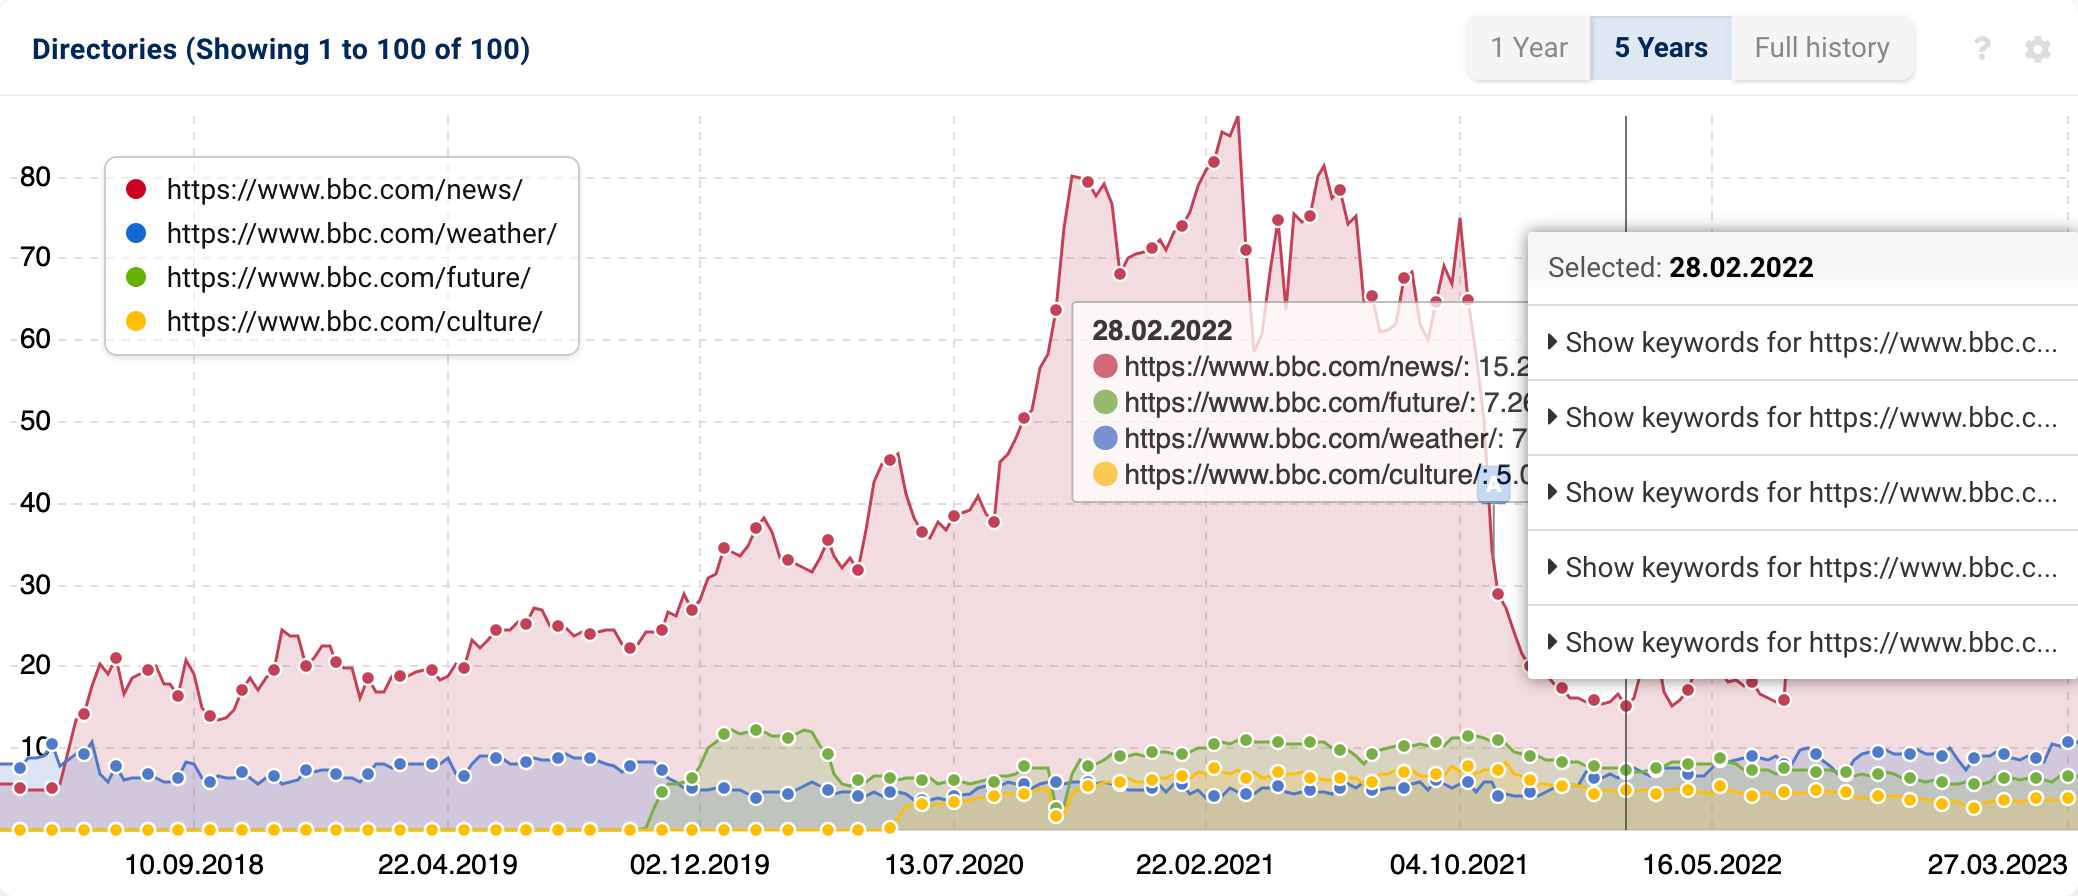
If you right-click on a specific point in the week, you can directly view the ranking keywords of a directory for the selected date.
You can also zoom in on the data by holding down the mouse button and highlighting a specific date range.
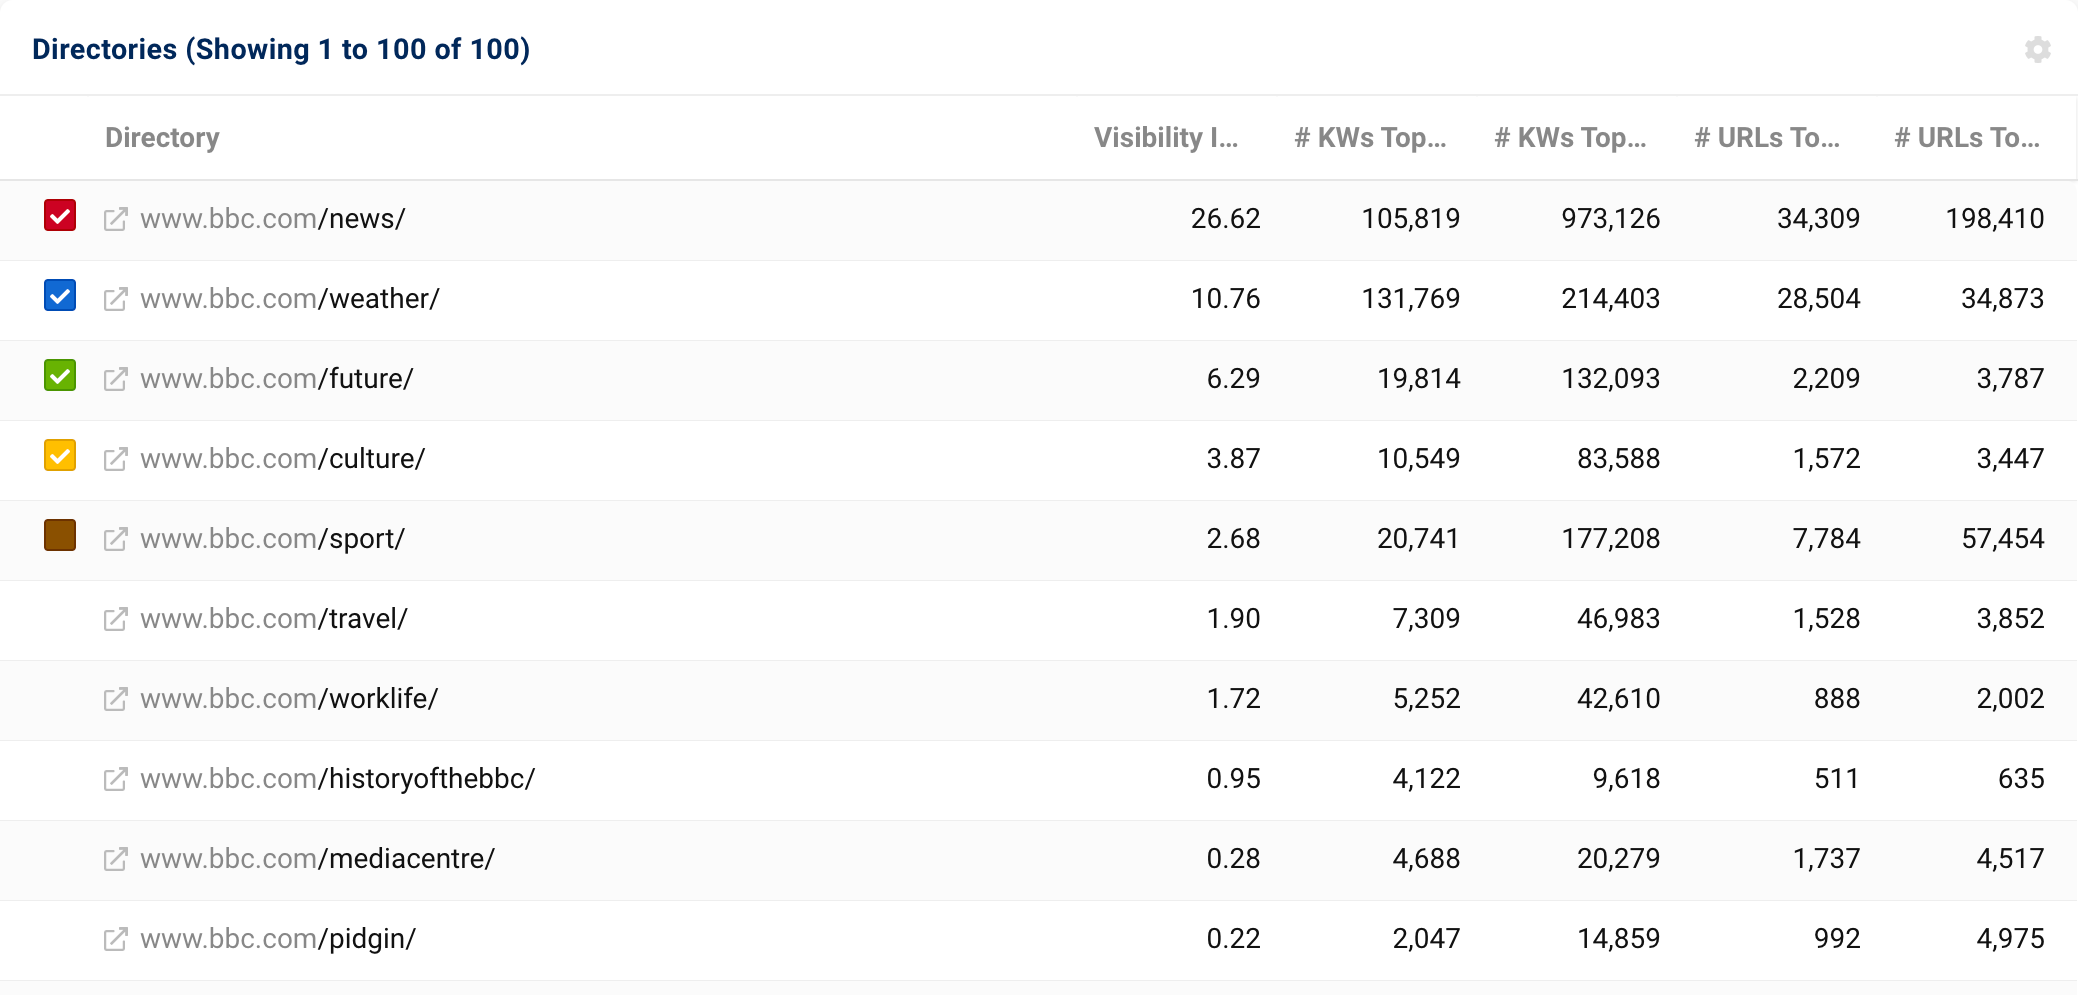
Below the data box with the visibility histories of the directories, you will find the corresponding table with specific data.
- The Visibility Index of the respective directory. 1
- The number of keywords that rank in the Top 10 2 and Top 100 3 search results.
- The number of URLs of the directory that rank for keywords in the Top 10 4 or Top 100 5 search results.
With this data, you can quickly find out which directories of a website exist and which of them perform well or have performed well.
If you want to compare other directories than the selected four, use the option “Overlay Data” via the cogwheel in the top right corner of the data box.
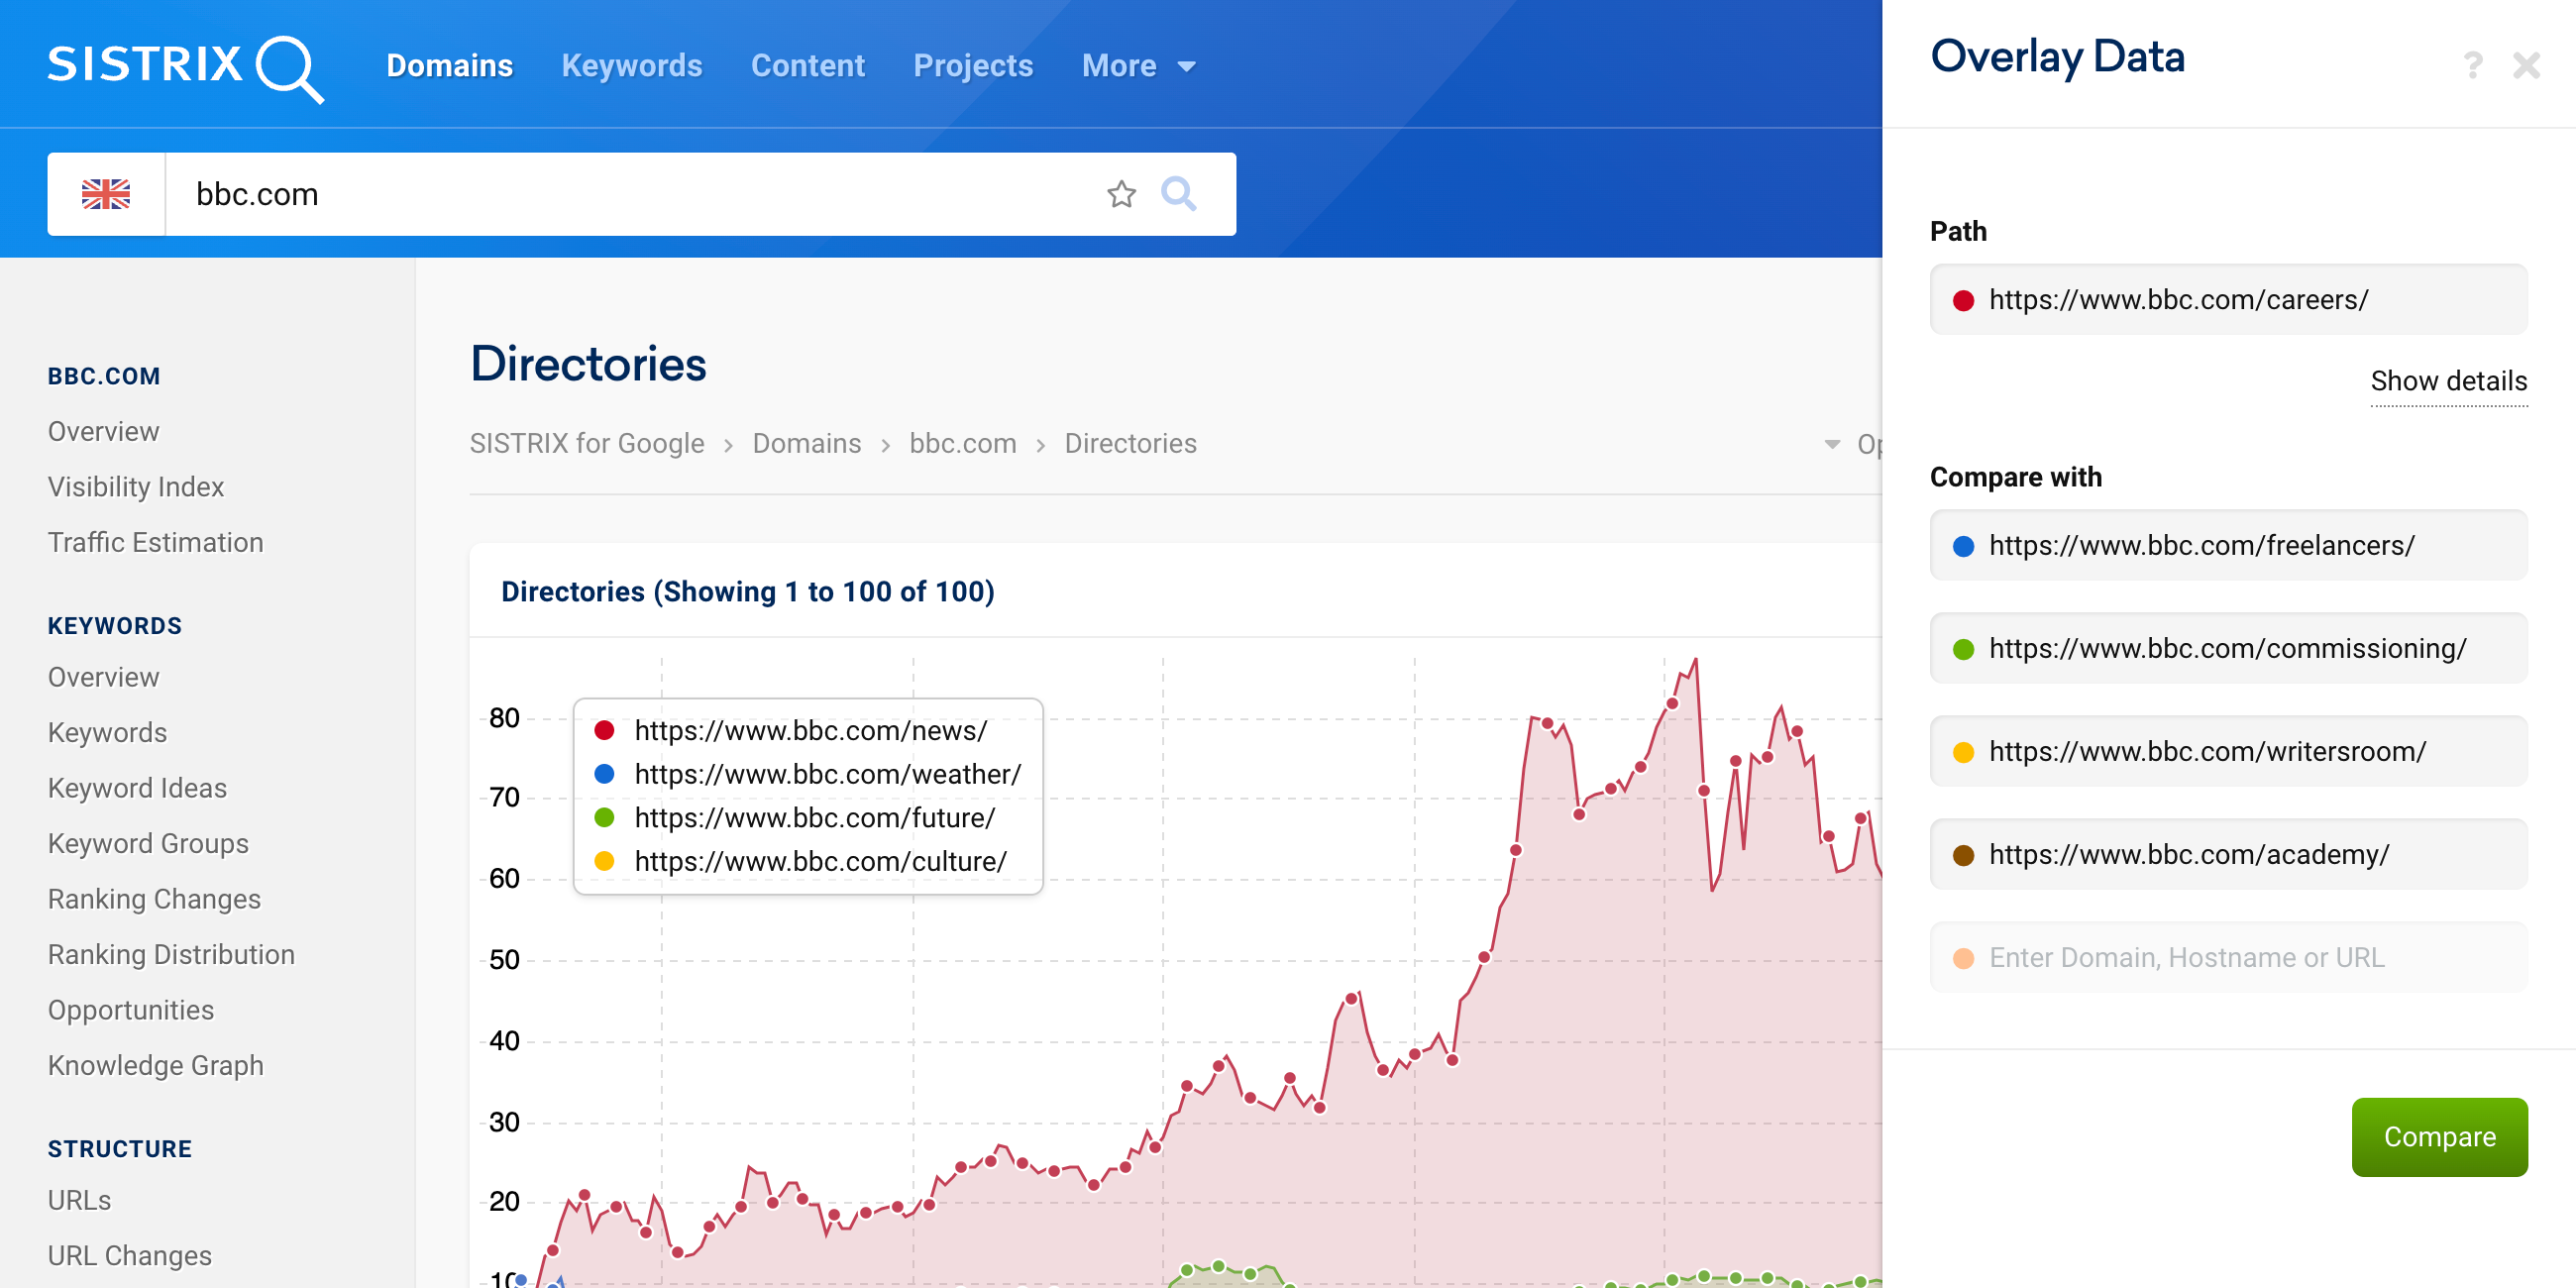
Instead of the strongest four directories of the domain bbc.com, for example, we have now entered directories related to “careers” in order to compare them with each other.
Note that directories must start with the protocol (e.g., https://) and end with /.
Comparison of directories from different domains
You can, of course, not only compare directories from one domain, but also directories from different domains.
It is helpful to be able to see whether a section of your own domain or that of your competitors is performing better or worse. Thus, your domain as a whole may prove to be gaining visibility, but a single directory that is important to you may be slowly losing visibility.
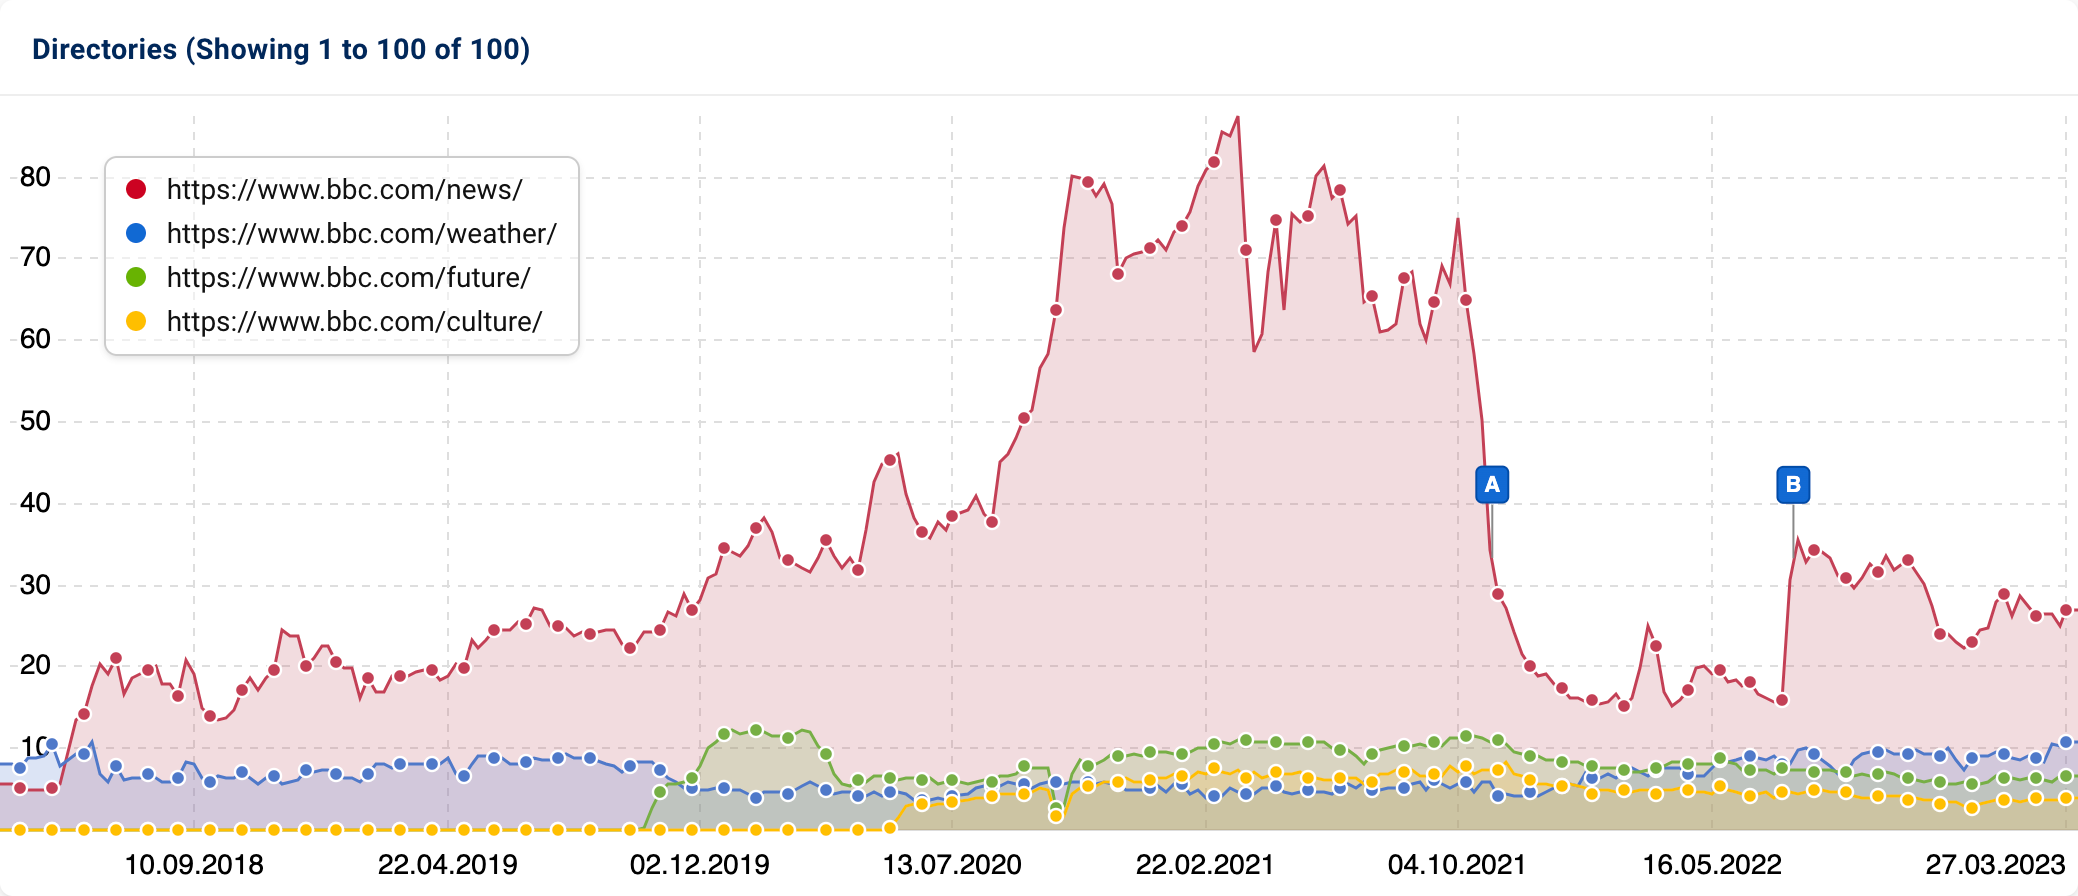
When comparing the strongest directories of bbc.com, we have seen, for example, that the /culture/ directory has grown slowly since mid-2020, but has almost been stagnating since 2022. It accounts for nowhere near the share of visibility that the /news/ directory has had for years.
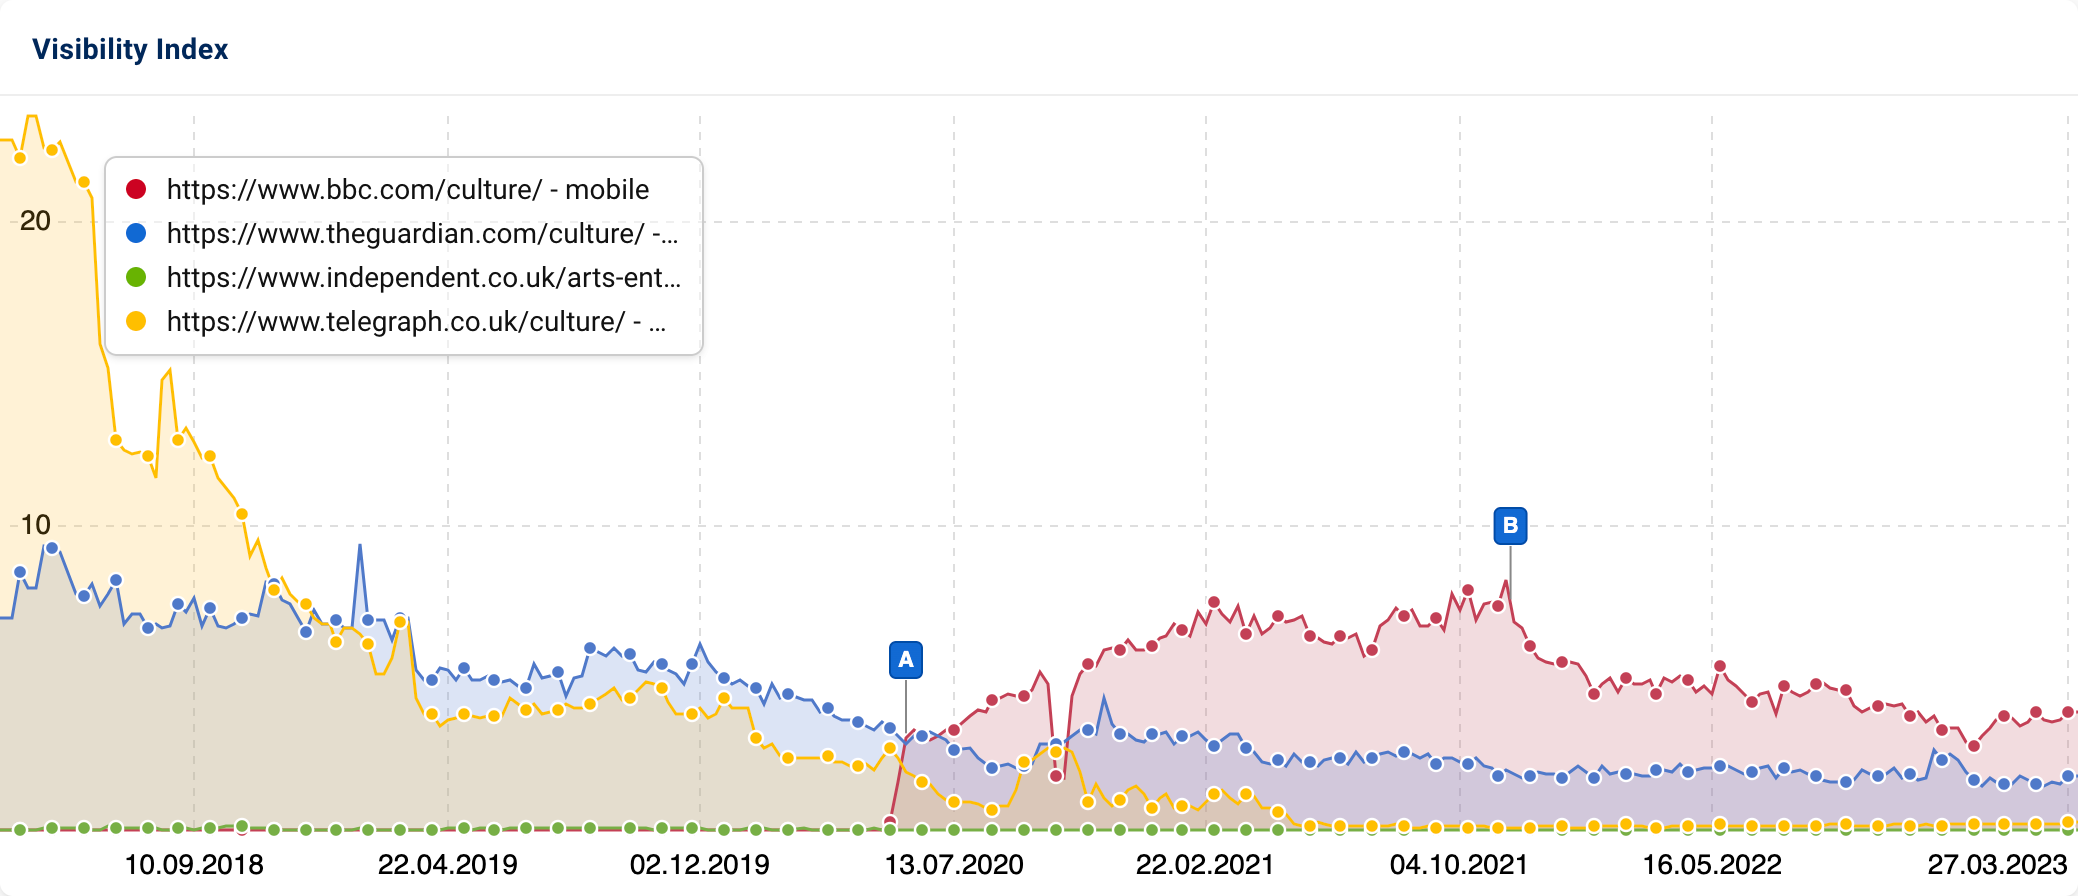
However, if we look at this bbc.com directory in comparison with other, comparable directories from other news websites, we see that bbc.com/culture/ has grown much more during this time period than the competitors’ directories.
Subdirectory analysis
Since the data in SISTRIX is available up to the URL level, you can segment a website more and more finely. This also includes the possibility of evaluating the most important KPIs of subdirectories.
You can start the analysis in different ways.
If you are still in the “Directories” subsection, simply click on one of the directories in the list.
You can do the same in any other table in SISTRIX. Hover the mouse over a URL, for example, and you can evaluate the desired part of this URL – for example a directory – individually.

You can also simply enter the desired directory in the SISTRIX search bar. Remember to start with the protocol (e.g., https://) and put a / at the end of the entry if it is not already there.
No matter which way you enter the directory, you will end up on the overview page for that specific directory.
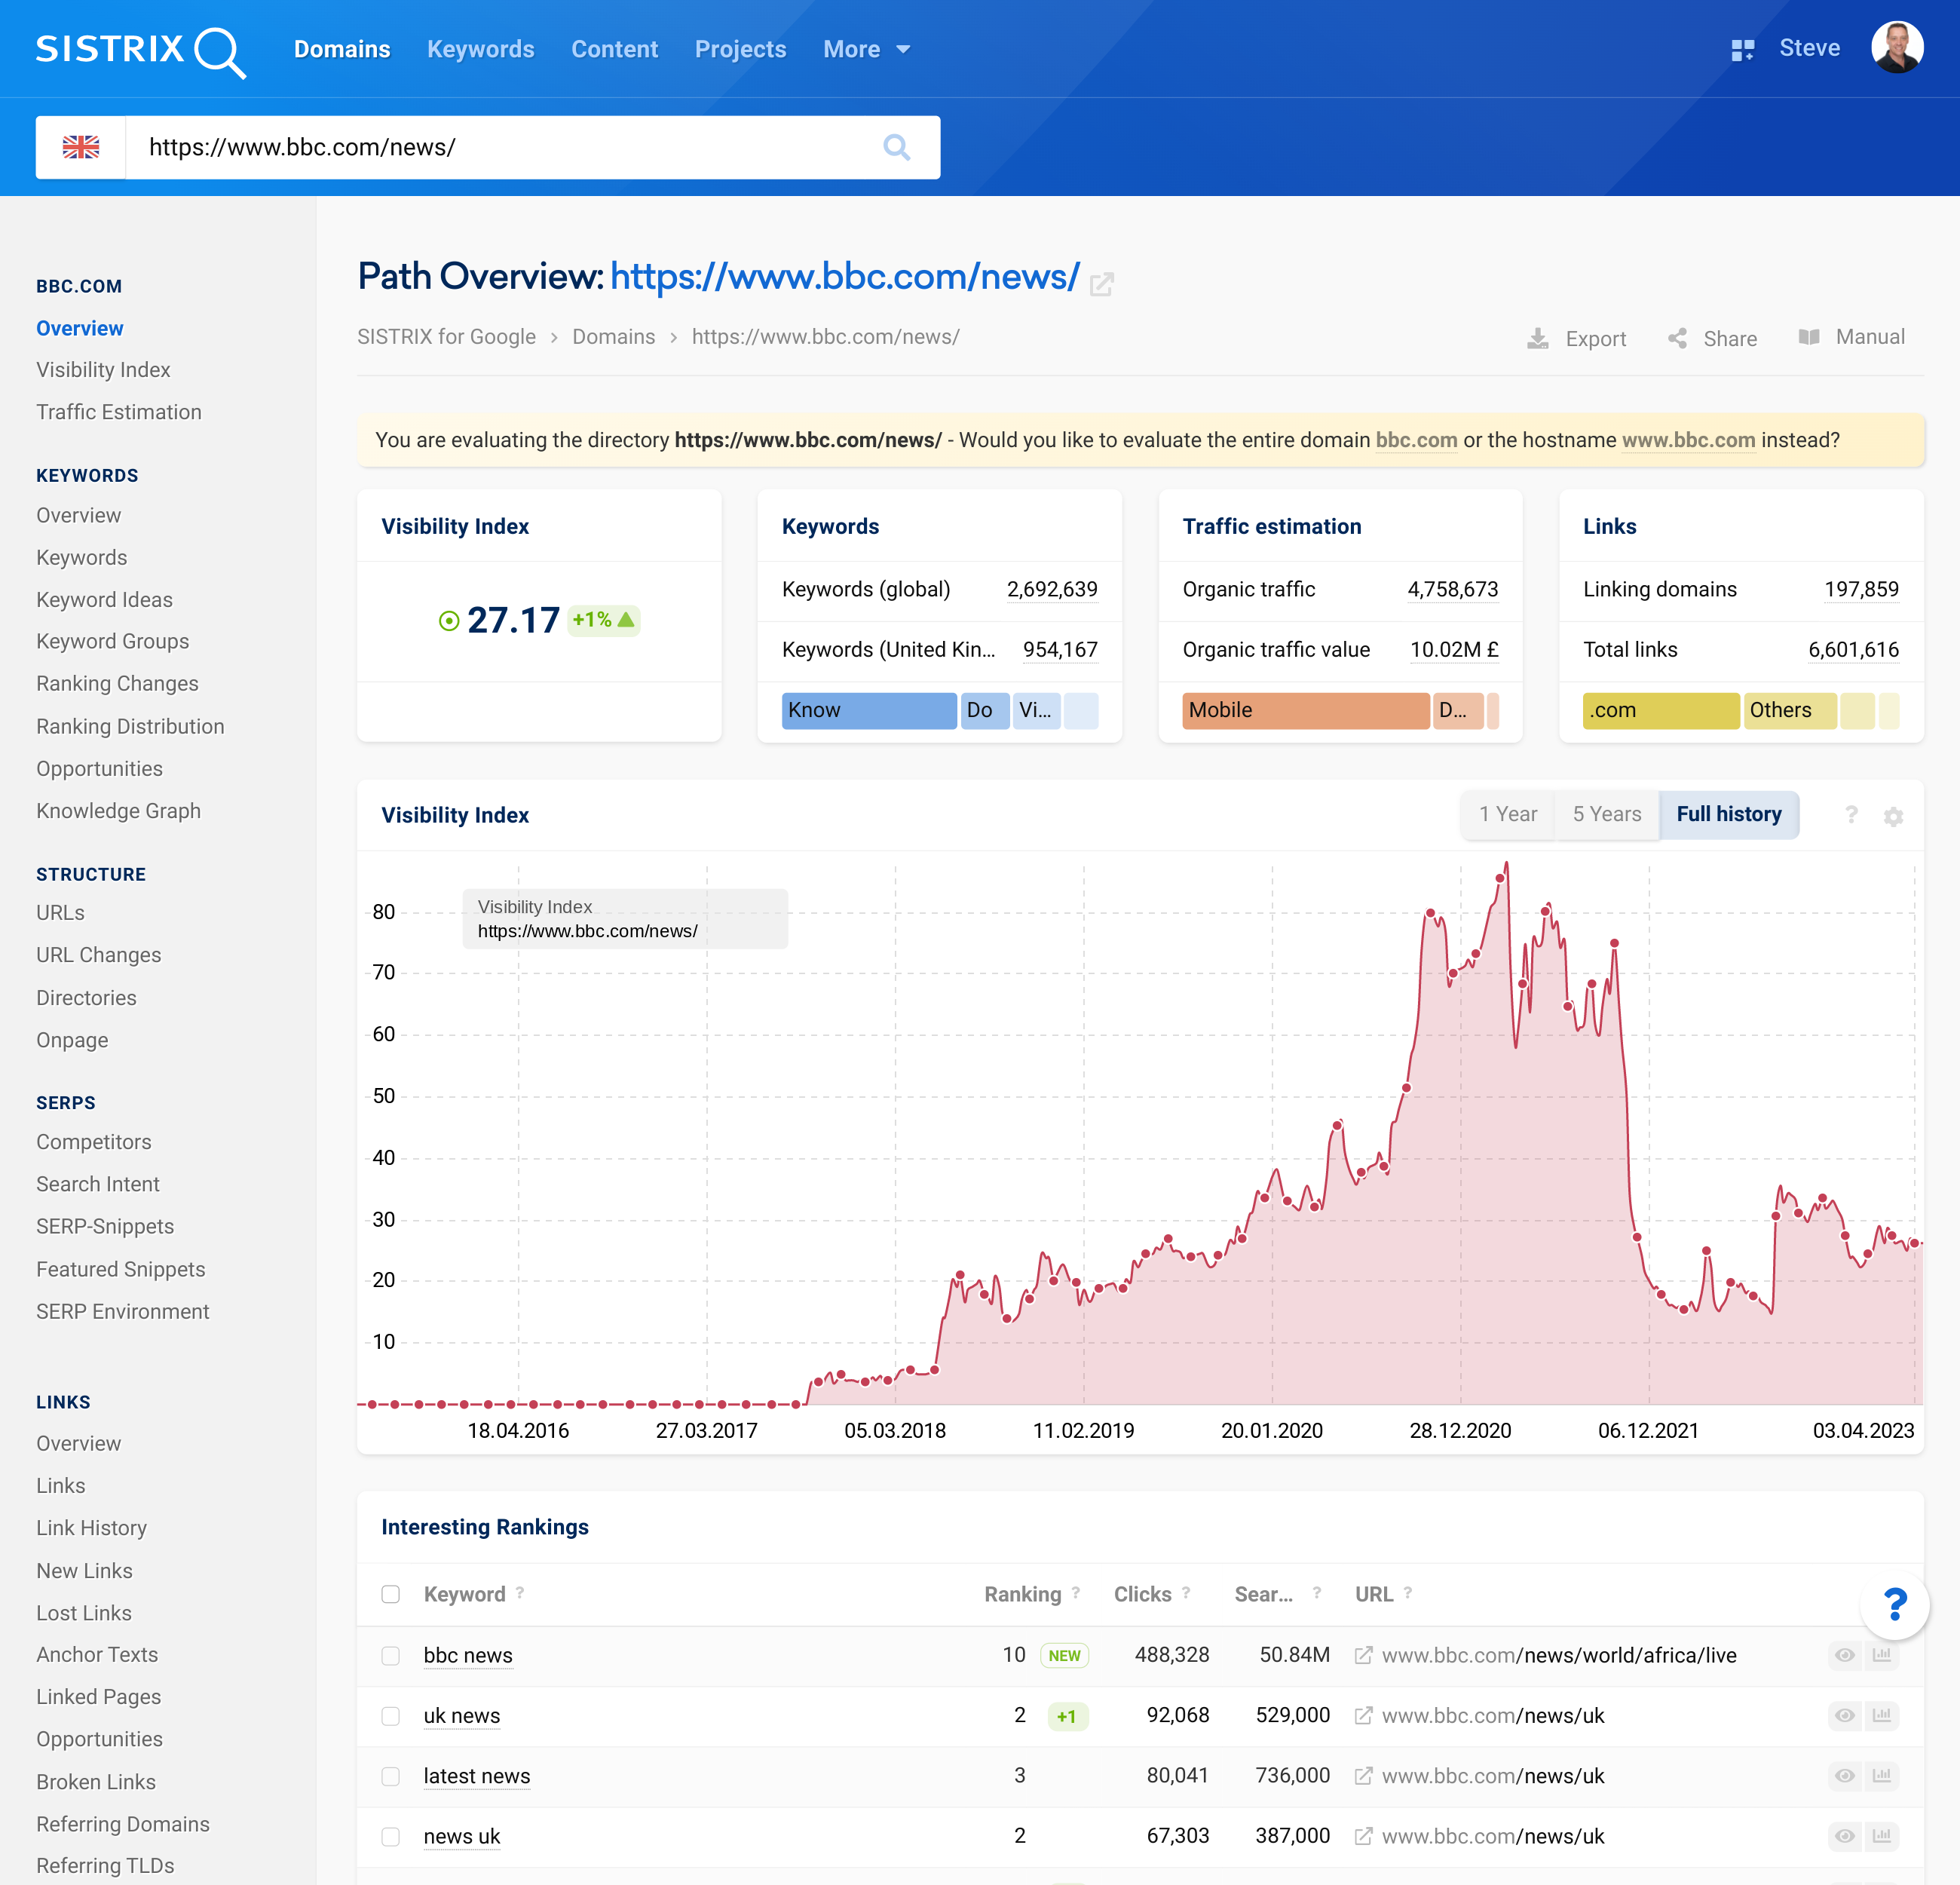
Here, you will find the most important KPIs such as the Visibility Index of the directory, the number of keywords, traffic estimates, links and interesting rankings.
All features in the navigation on the left-hand side always refer to the area (domain, host, directory or URL) that is currently displayed in the search bar. The yellow box at the top also indicates this.
When evaluating a directory, as seen in the image at 1, you can select the entry “Directories” 2 again. This will show you the subdirectories that achieved the highest rankings 3.
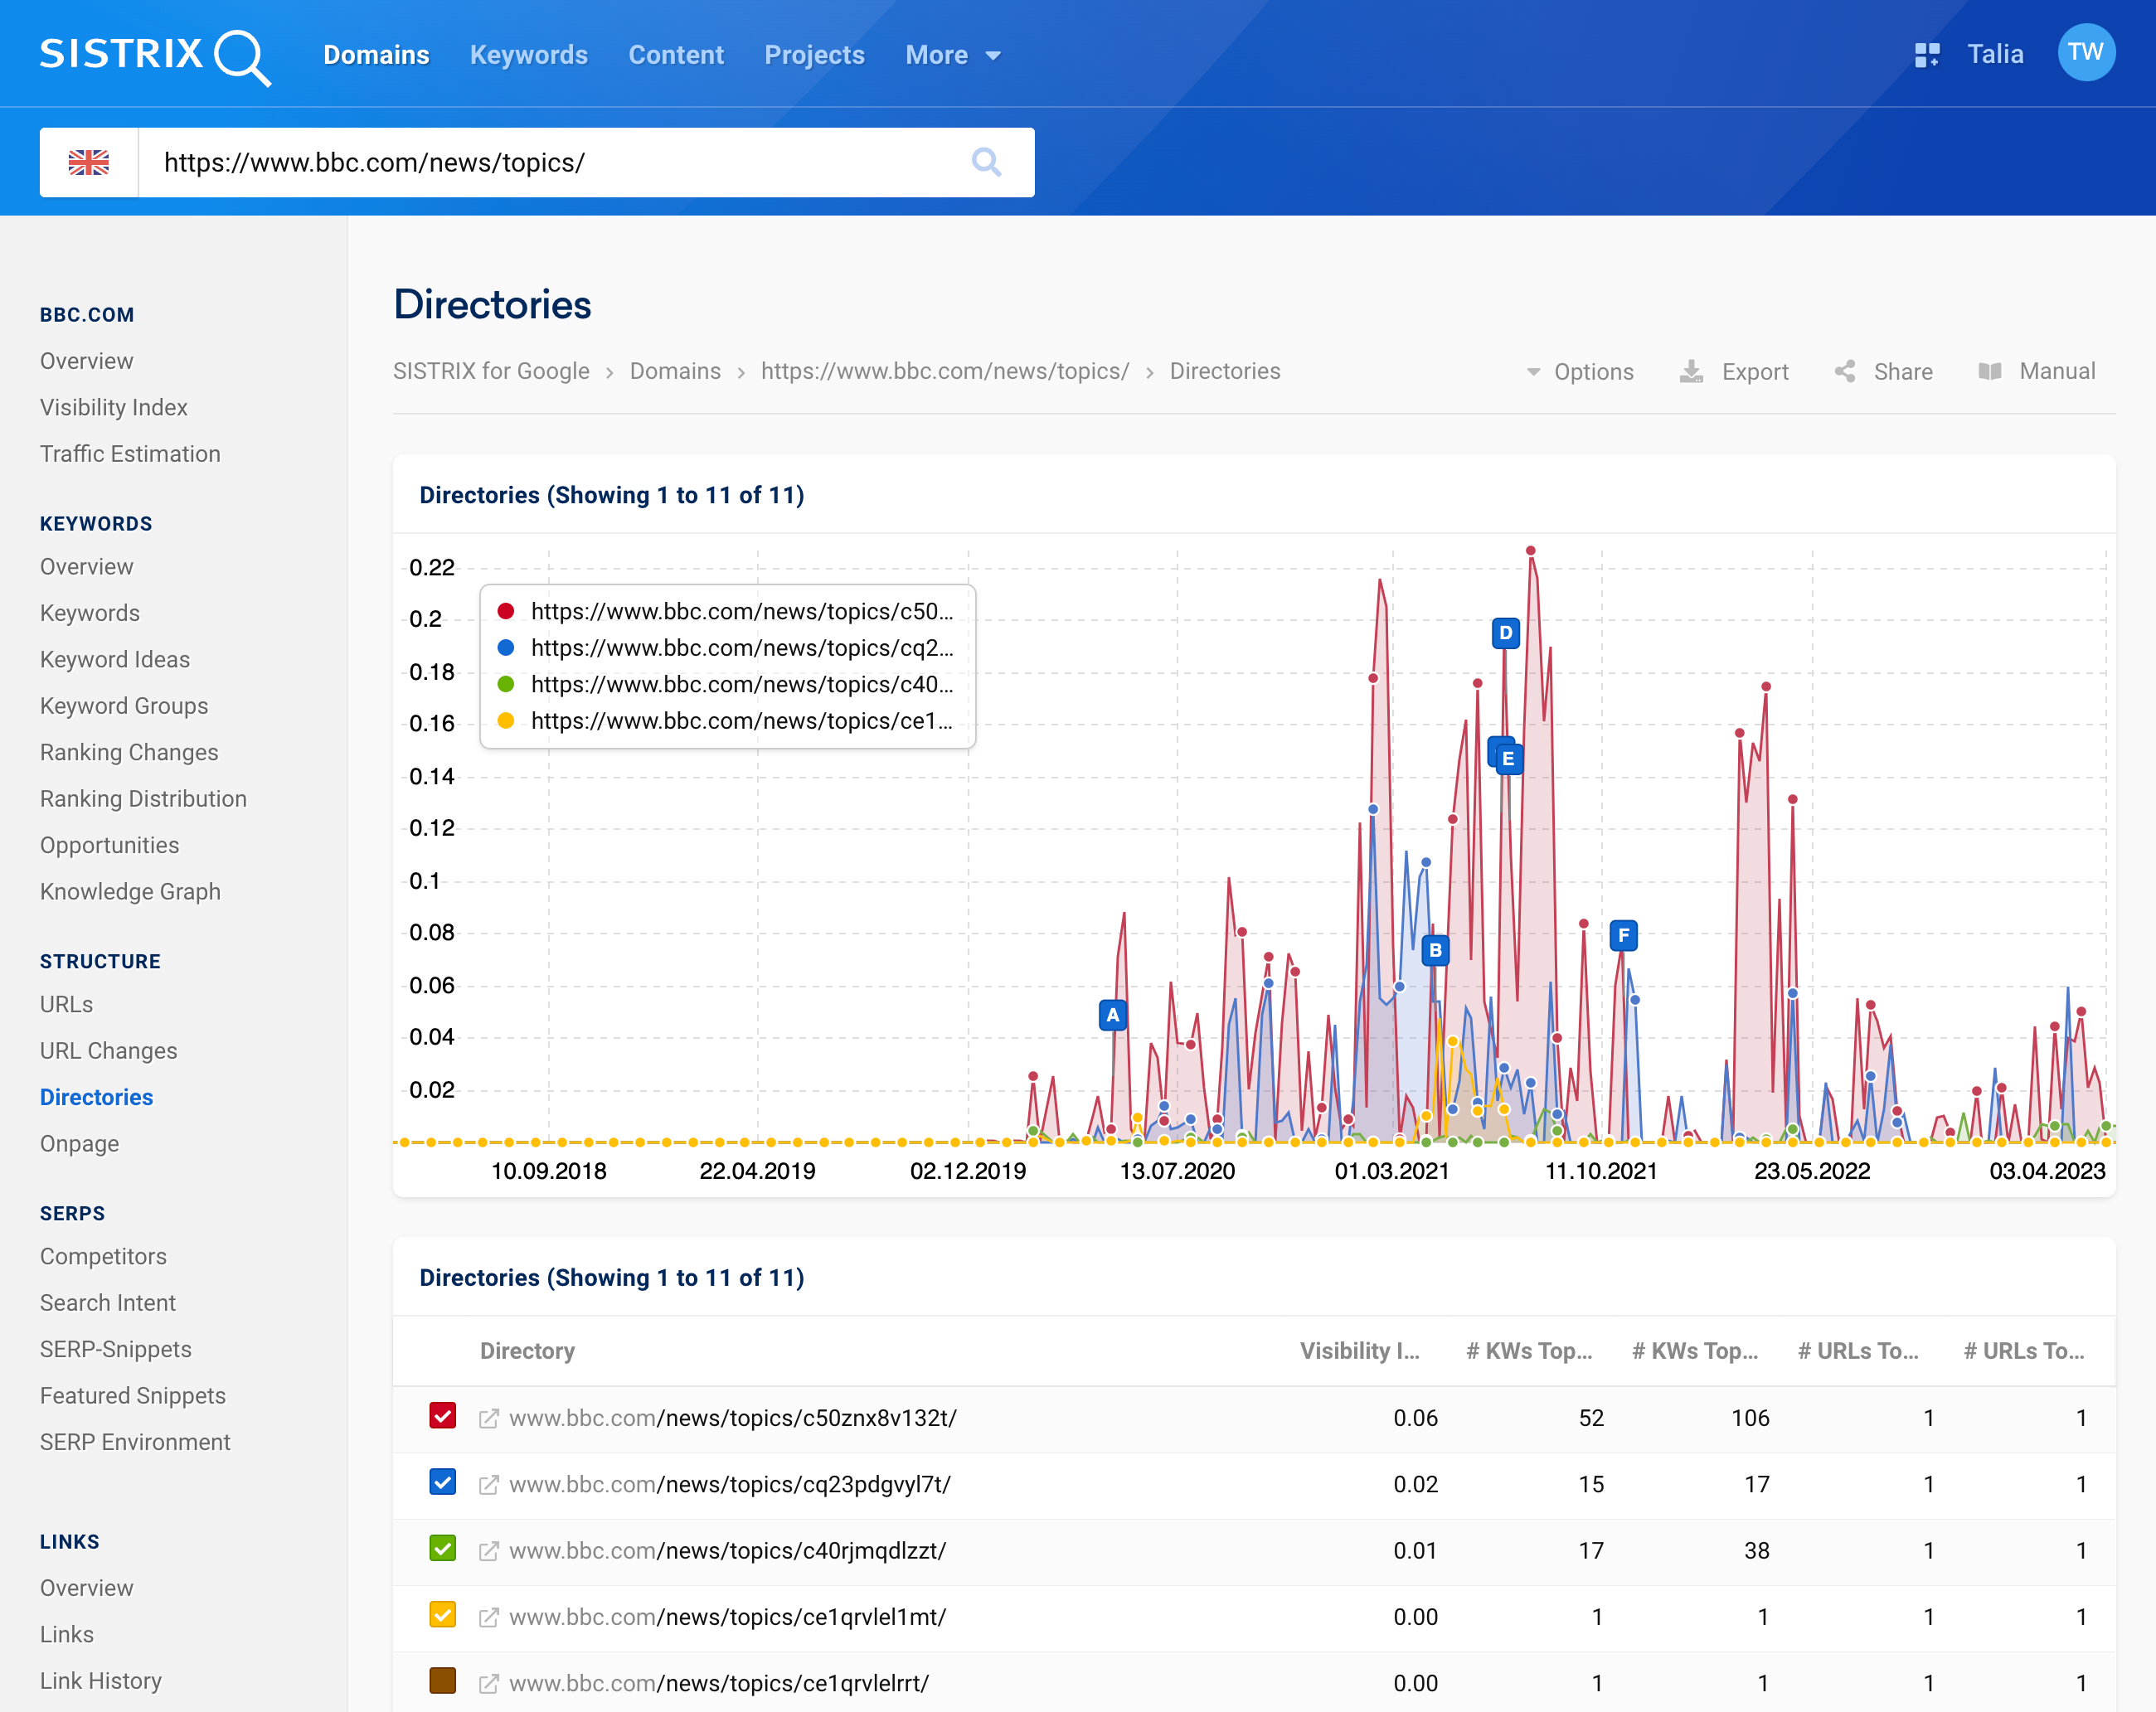
From here, you can click on another subdirectory and go to the directory overview again to break down the structure even more. This way, you can get to the bottom of changes in smaller subdirectories that may have an impact on the whole directory.
As usual with SISTRIX, you can do this not only for your own domain, but also for those of your competitors, for example.
Domain and business intelligence
Being able to analyse data at directory level allows you to obtain a vast amount of advanced information on a range of products, new releases and historical business decisions. This is especially useful if you are planning to buy a domain, analyse a competitor or keep an eye on the website of a particular company.
Let’s take a look at Apple, for example. They are famous for keeping their products secret until the very end, and any leaked information is valuable. So keep an eye on Apple’s rankings in the /iphone/ directory, for example, in case Apple accidentally releases information too early for Google’s crawler to see.

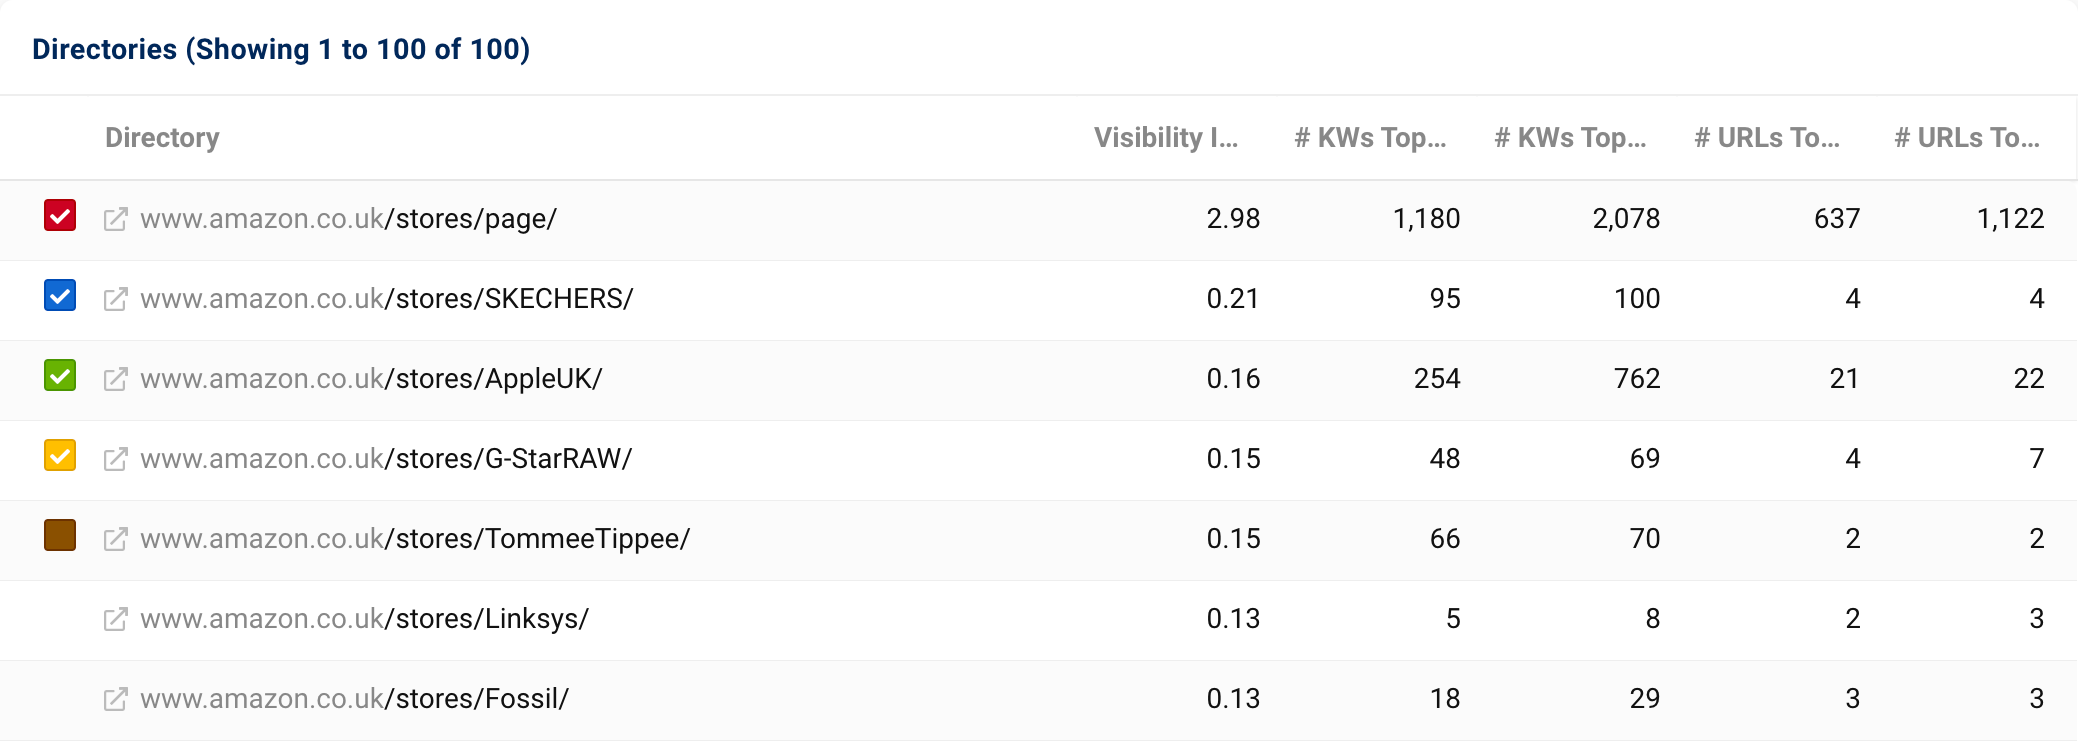
Or how about breaking Amazon down by the most visible /stores in the Google index? In this case, it may even be worth looking at the data at URL level.
Let’s look at the competitors of a smaller website for motorcycle accessories for our next example. There we came across interesting rankings of a motorcycle insurance website.
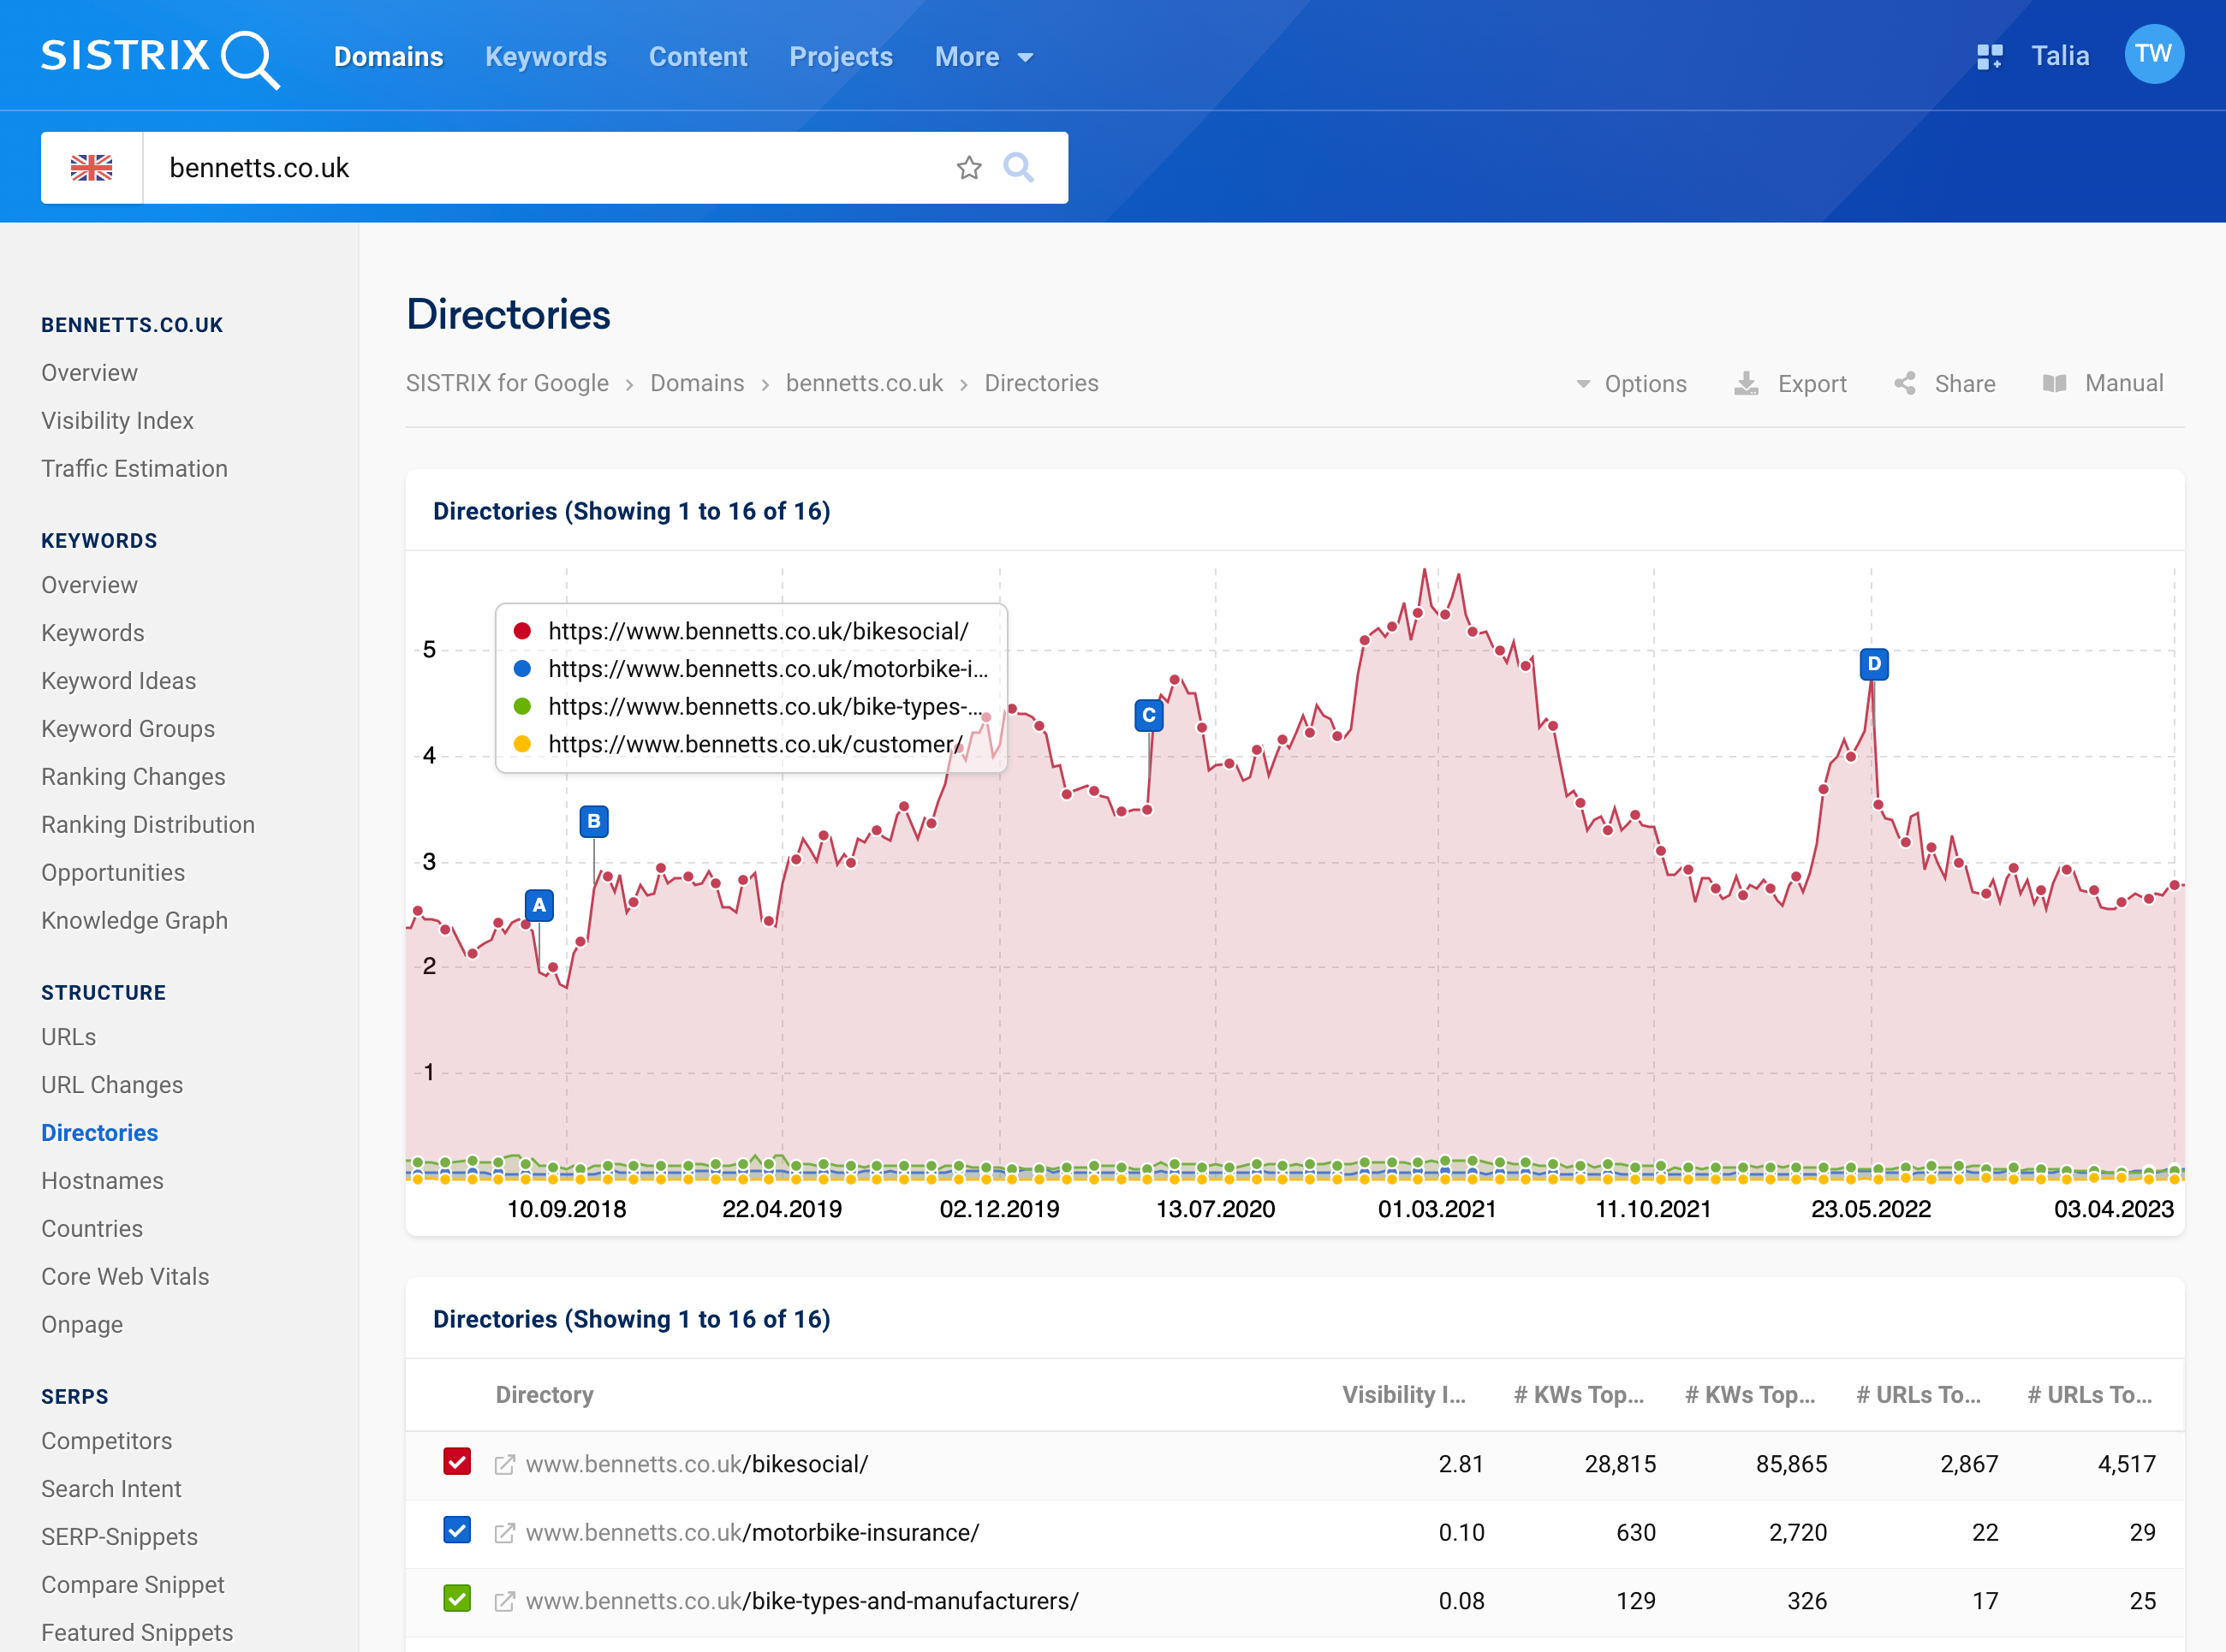
If we segment this insurance website into its directories, we notice very quickly that most of the visibility comes through the directory /bikesocial/, an informative magazine.
The graph clearly shows that the directory for insurance has stagnated, while the visibility of the magazine has steadily increased until around mid-2021. Here, the content strategy seems to have worked at first, then the SEO work may have been somewhat neglected.

From there, we can dive deeper into the subdirectories of /bikesocial/ and see what has worked there and why the visibility has tended to drop recently. This information can then be used to build a competitive content strategy.
