If you connect your SISTRIX account to Google Search Console and/or Google Analytics, the Toolbox will show you two additional sections where you can get an overview of those data and combine them with SISTRIX KPIs.
If you linked your websites’ property to the SISTRIX Toolbox, you can access your extended Search Console and Analytics data within the SEO module and have access to a number of key values from the Google Search Console and Google Analytics.
The menu points “Google Analytics” and “Google Search Console” will appear after you link the Toolbox to your data and will be available only for that specific domain in your account. No personal data will be transmitted.
Google Analytics

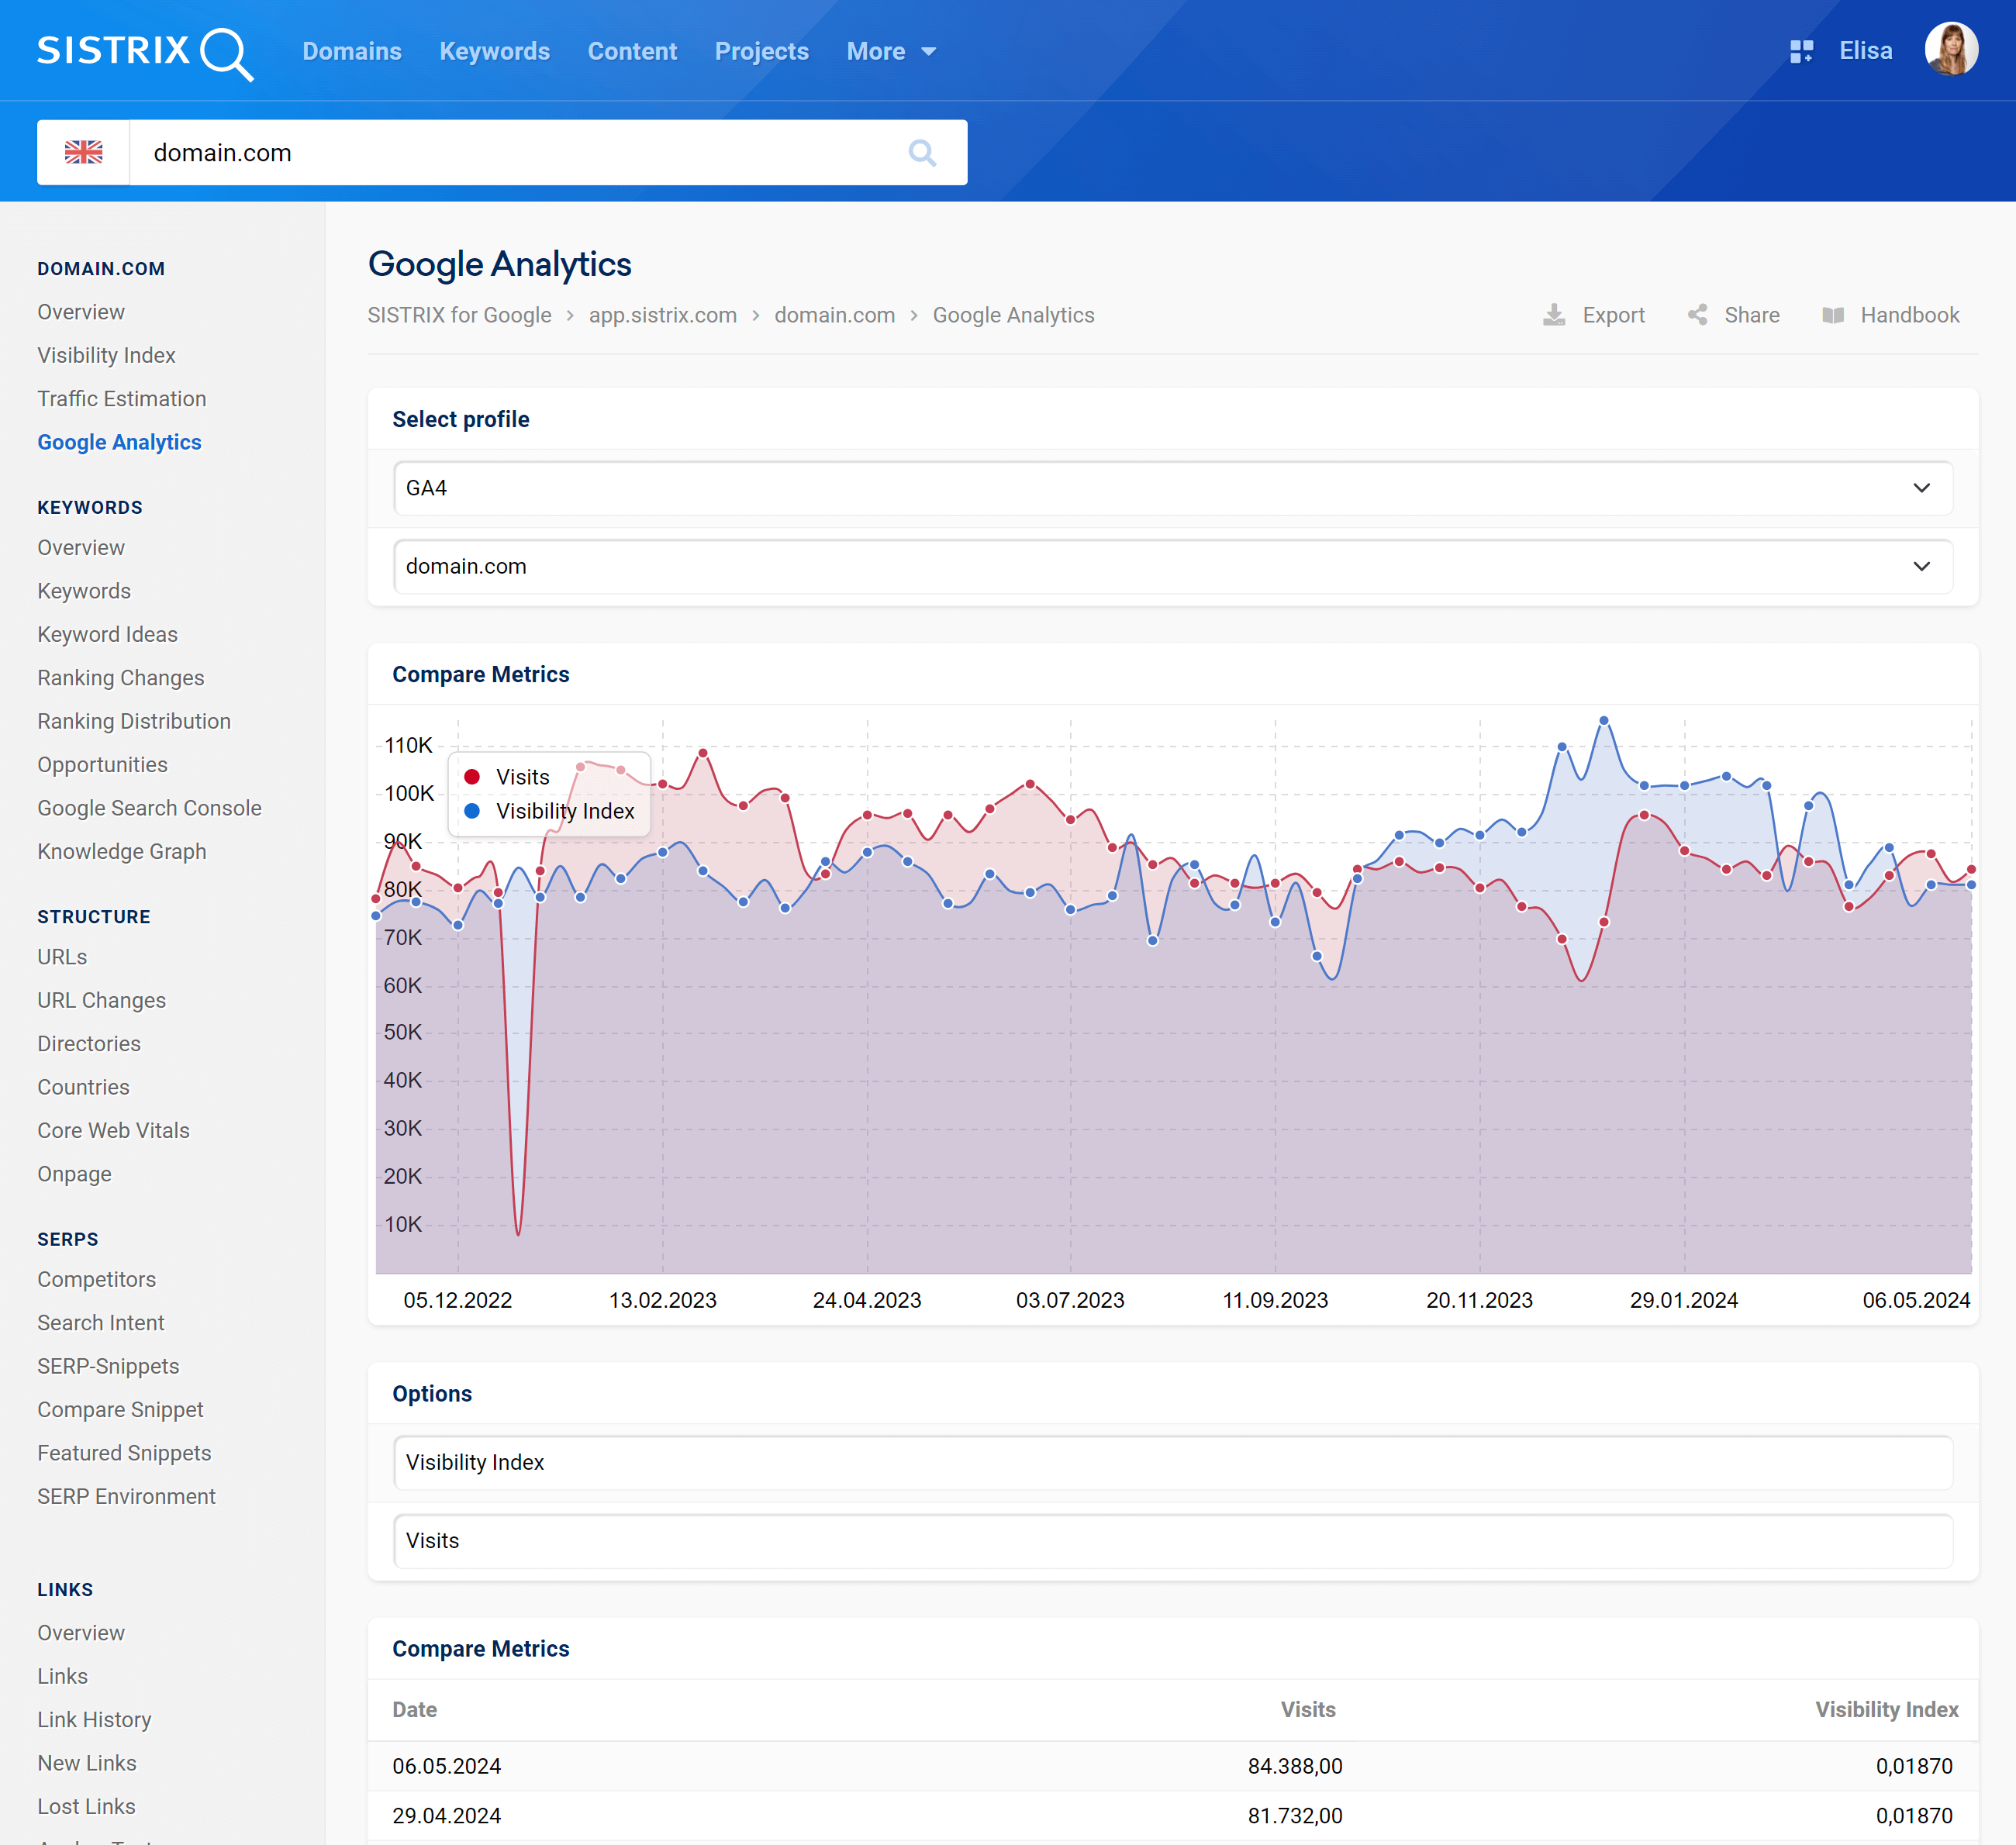
Compare Metrics Graph
Here you will find your connected Google Analytics data shown alongside a number of different metrics in a graph. The metrics can be changed using the Options right below the graph. By default, we always show the comparison between the Visibility Index and the number of visitors on a page. Updates occur weekly, and can be up to 13 days behind the current date.
When integrating Google Analytics into a webpage the values are also measured for subdomains, as long as you integrate the same Analytics-Code on those subdomains.
If you hover the mouse over the chart, the Toolbox will let you see the specific data for that week.
If you need to focus on a specific period of time, you can zoom into a specific date-range by holding the mouse button down and selecting the range you would like to focus on.
Also don’t forget that the cogwheel icon at the top right corner of the chart will offer you even more options and functions. For example, you’ll are able to add an event-pin to the chart.
Comparison Options
Select metrics from the SISTRIX data to be compared with metrics from the domain Analytics data.
The Toolbox metrics available are:
- Visibility Index
- Indexed pages
- Number of Top-100 keywords
- Number of Top-10 keywords
- Pagerank
The Google Analytics metrics available are:
- Visits
- Visitors
- Organic search
- New visitors
- Bounces
- Entrancies
- Page-views
- Bounce-Rate
- Average Pageviews per Visit
- Bounce-Entrance-Rate
You can also hide the Toolbox metrics from the graph and see only the Google Analytics data. To do so, select “Hide” from the first drop-down menu.
Compare Metrics Table
Here you will find your connected Google Analytics data shown alongside a number of different metrics as a table. The metrics can be changed using the “Options” menu right above the table. Updates occur weekly, and can be up to 13 days behind the current date.
Google Search Console

Profile Selection
Use the drop-down menu to select the Google Search Console profile that you want to analyse.
Clicks & Impressions
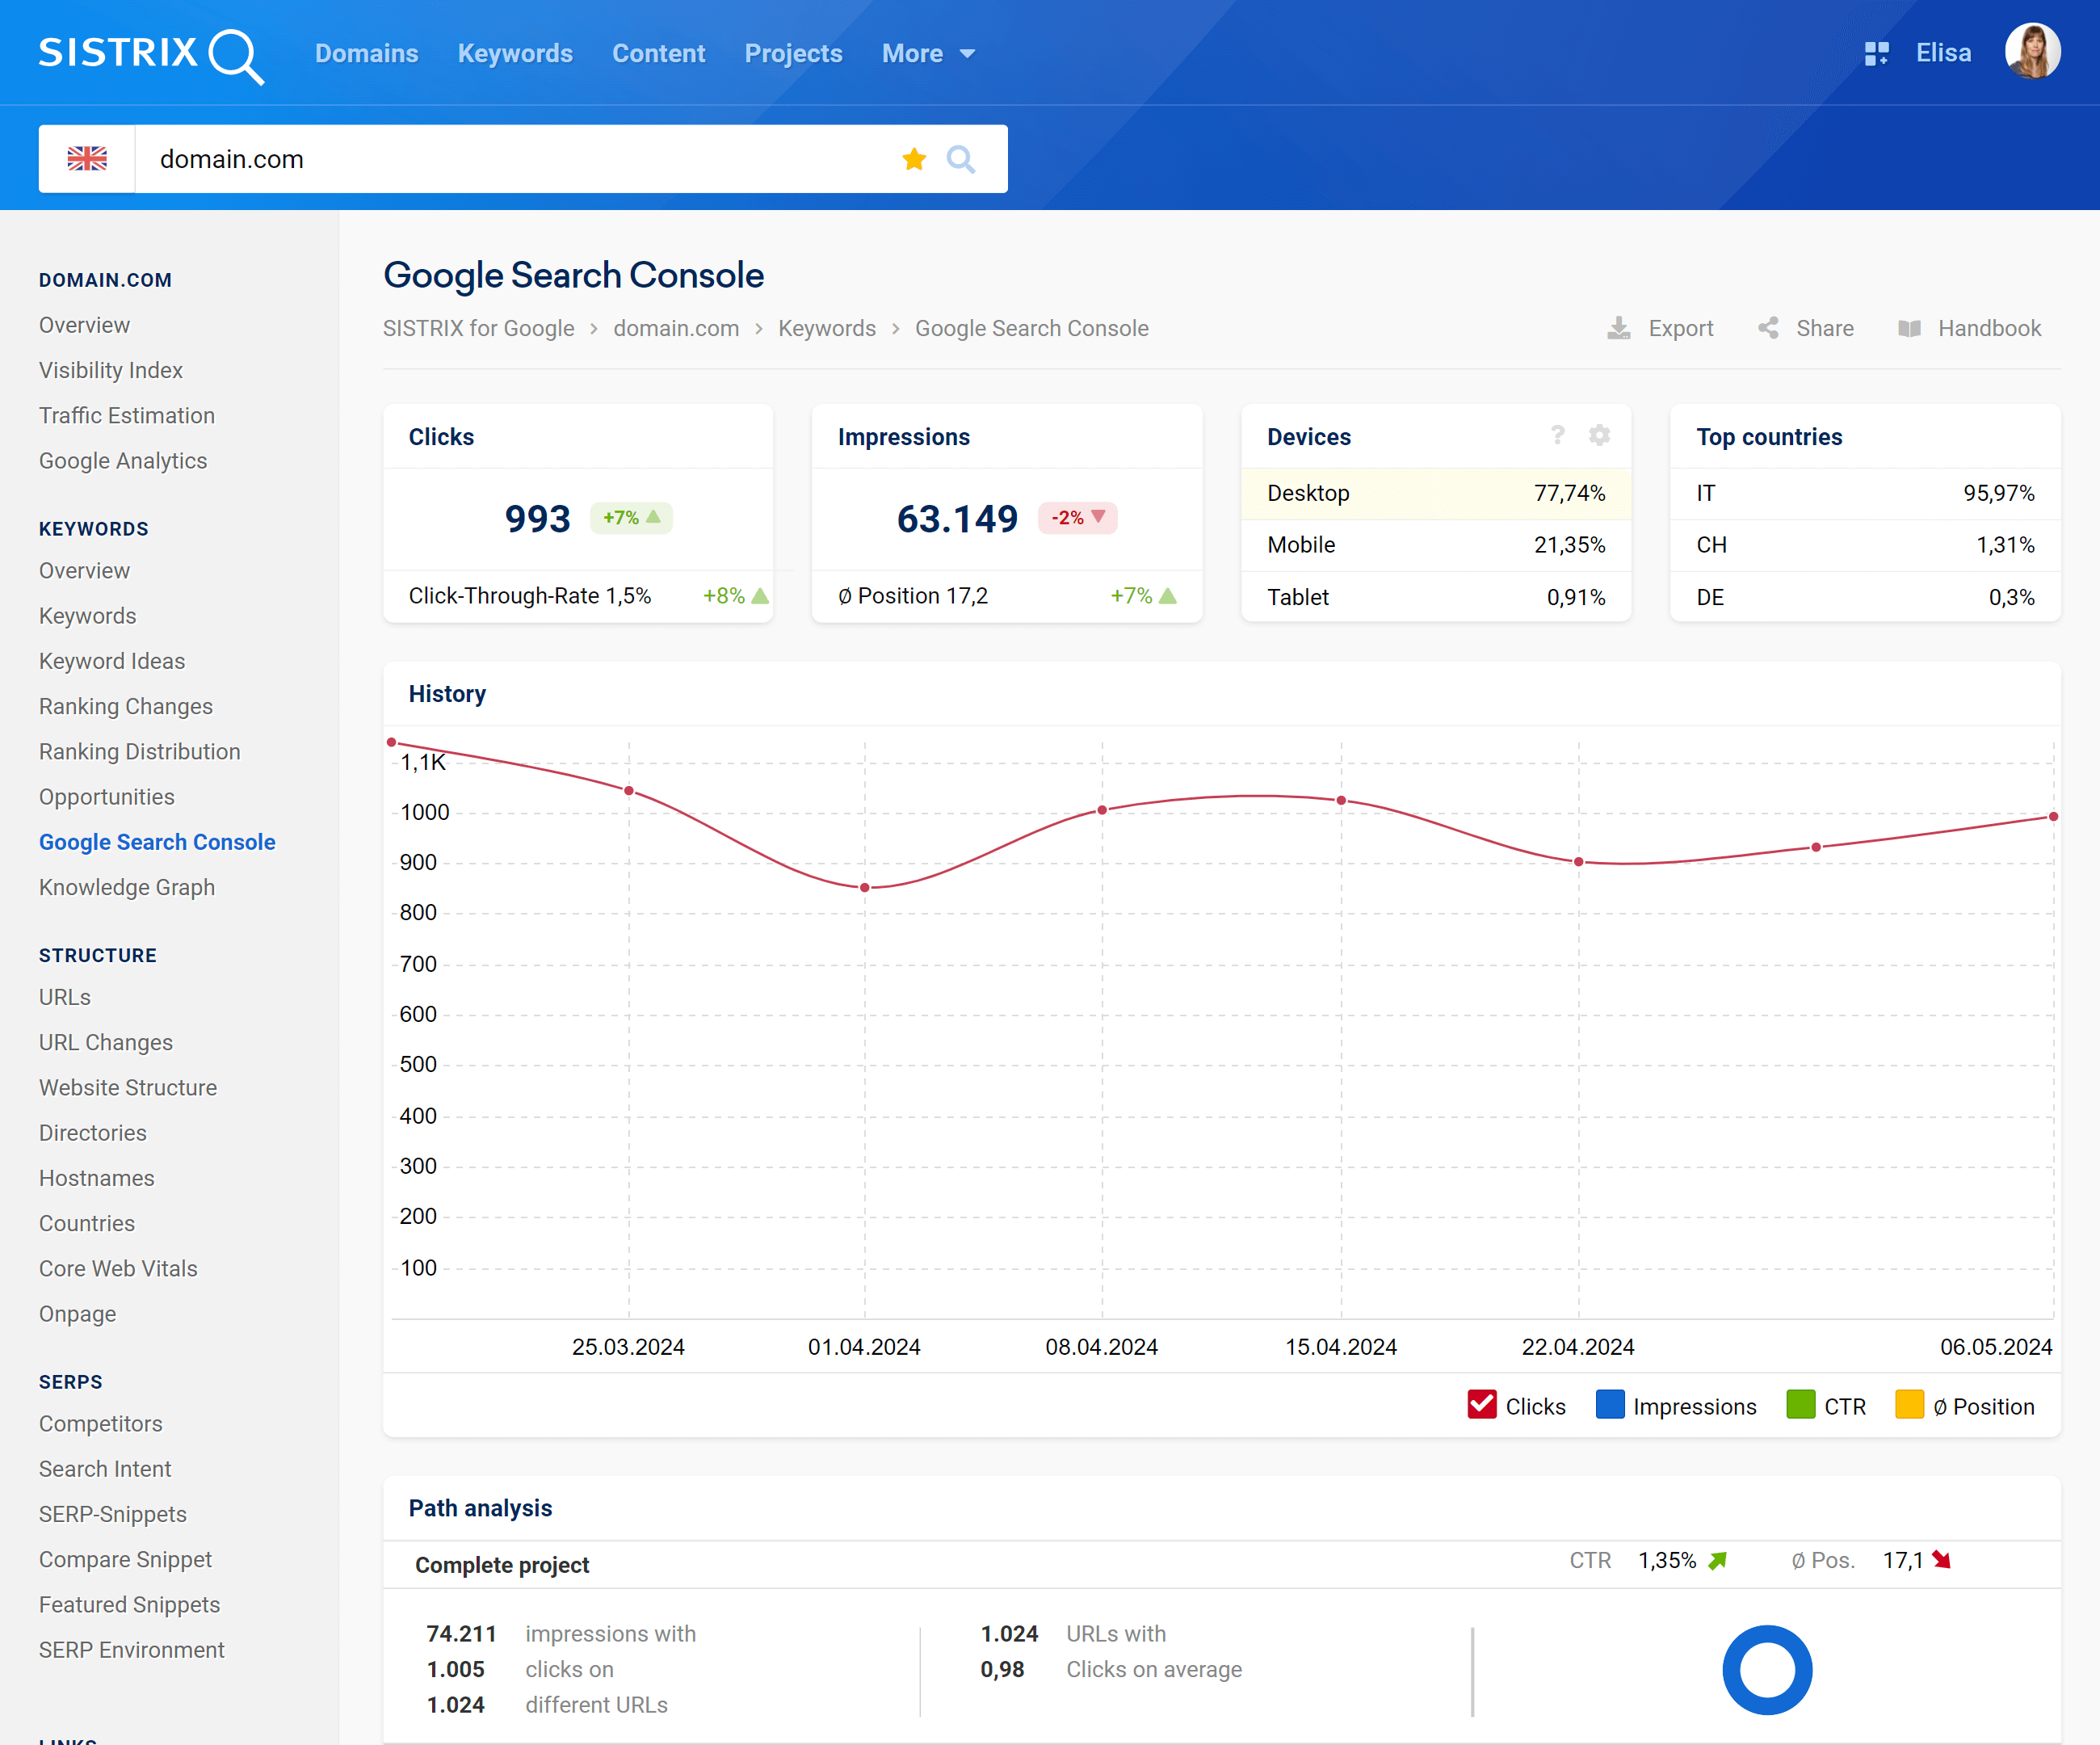
These figures, in the first two boxes on the page, give an overview of totals and the recent changes for total number of clicks and the click-through-rate, the impressions and average position from your Google Search Console Data. More information is shown in the graph and directory break down below.
Note: To view the actual keywords, go to the “Keywords” menu item.
Devices & Top Countries
The following two boxes show which devices (mobile, desktop and tablet) and countries (top three) the traffic is coming from, as reported by Search Console.
Performance history
To help you monitor progress and changes in traffic we provide you with various data sets from Google Search Console.
Click, impression, CTR and average position history is shown in this graph. Use the selectors at the bottom of the graph to focus on one metric.
Path Analysis
Here you’ll find the top directories / paths for this domain.
More specifically, you can see the number of impressions with a specific number of clicks on the different URLs and the number of URLs with a specific click average. Finally, you can also see the average CTR and position.
The data refer to the entire project and to the different directories of the website for the selected Country.