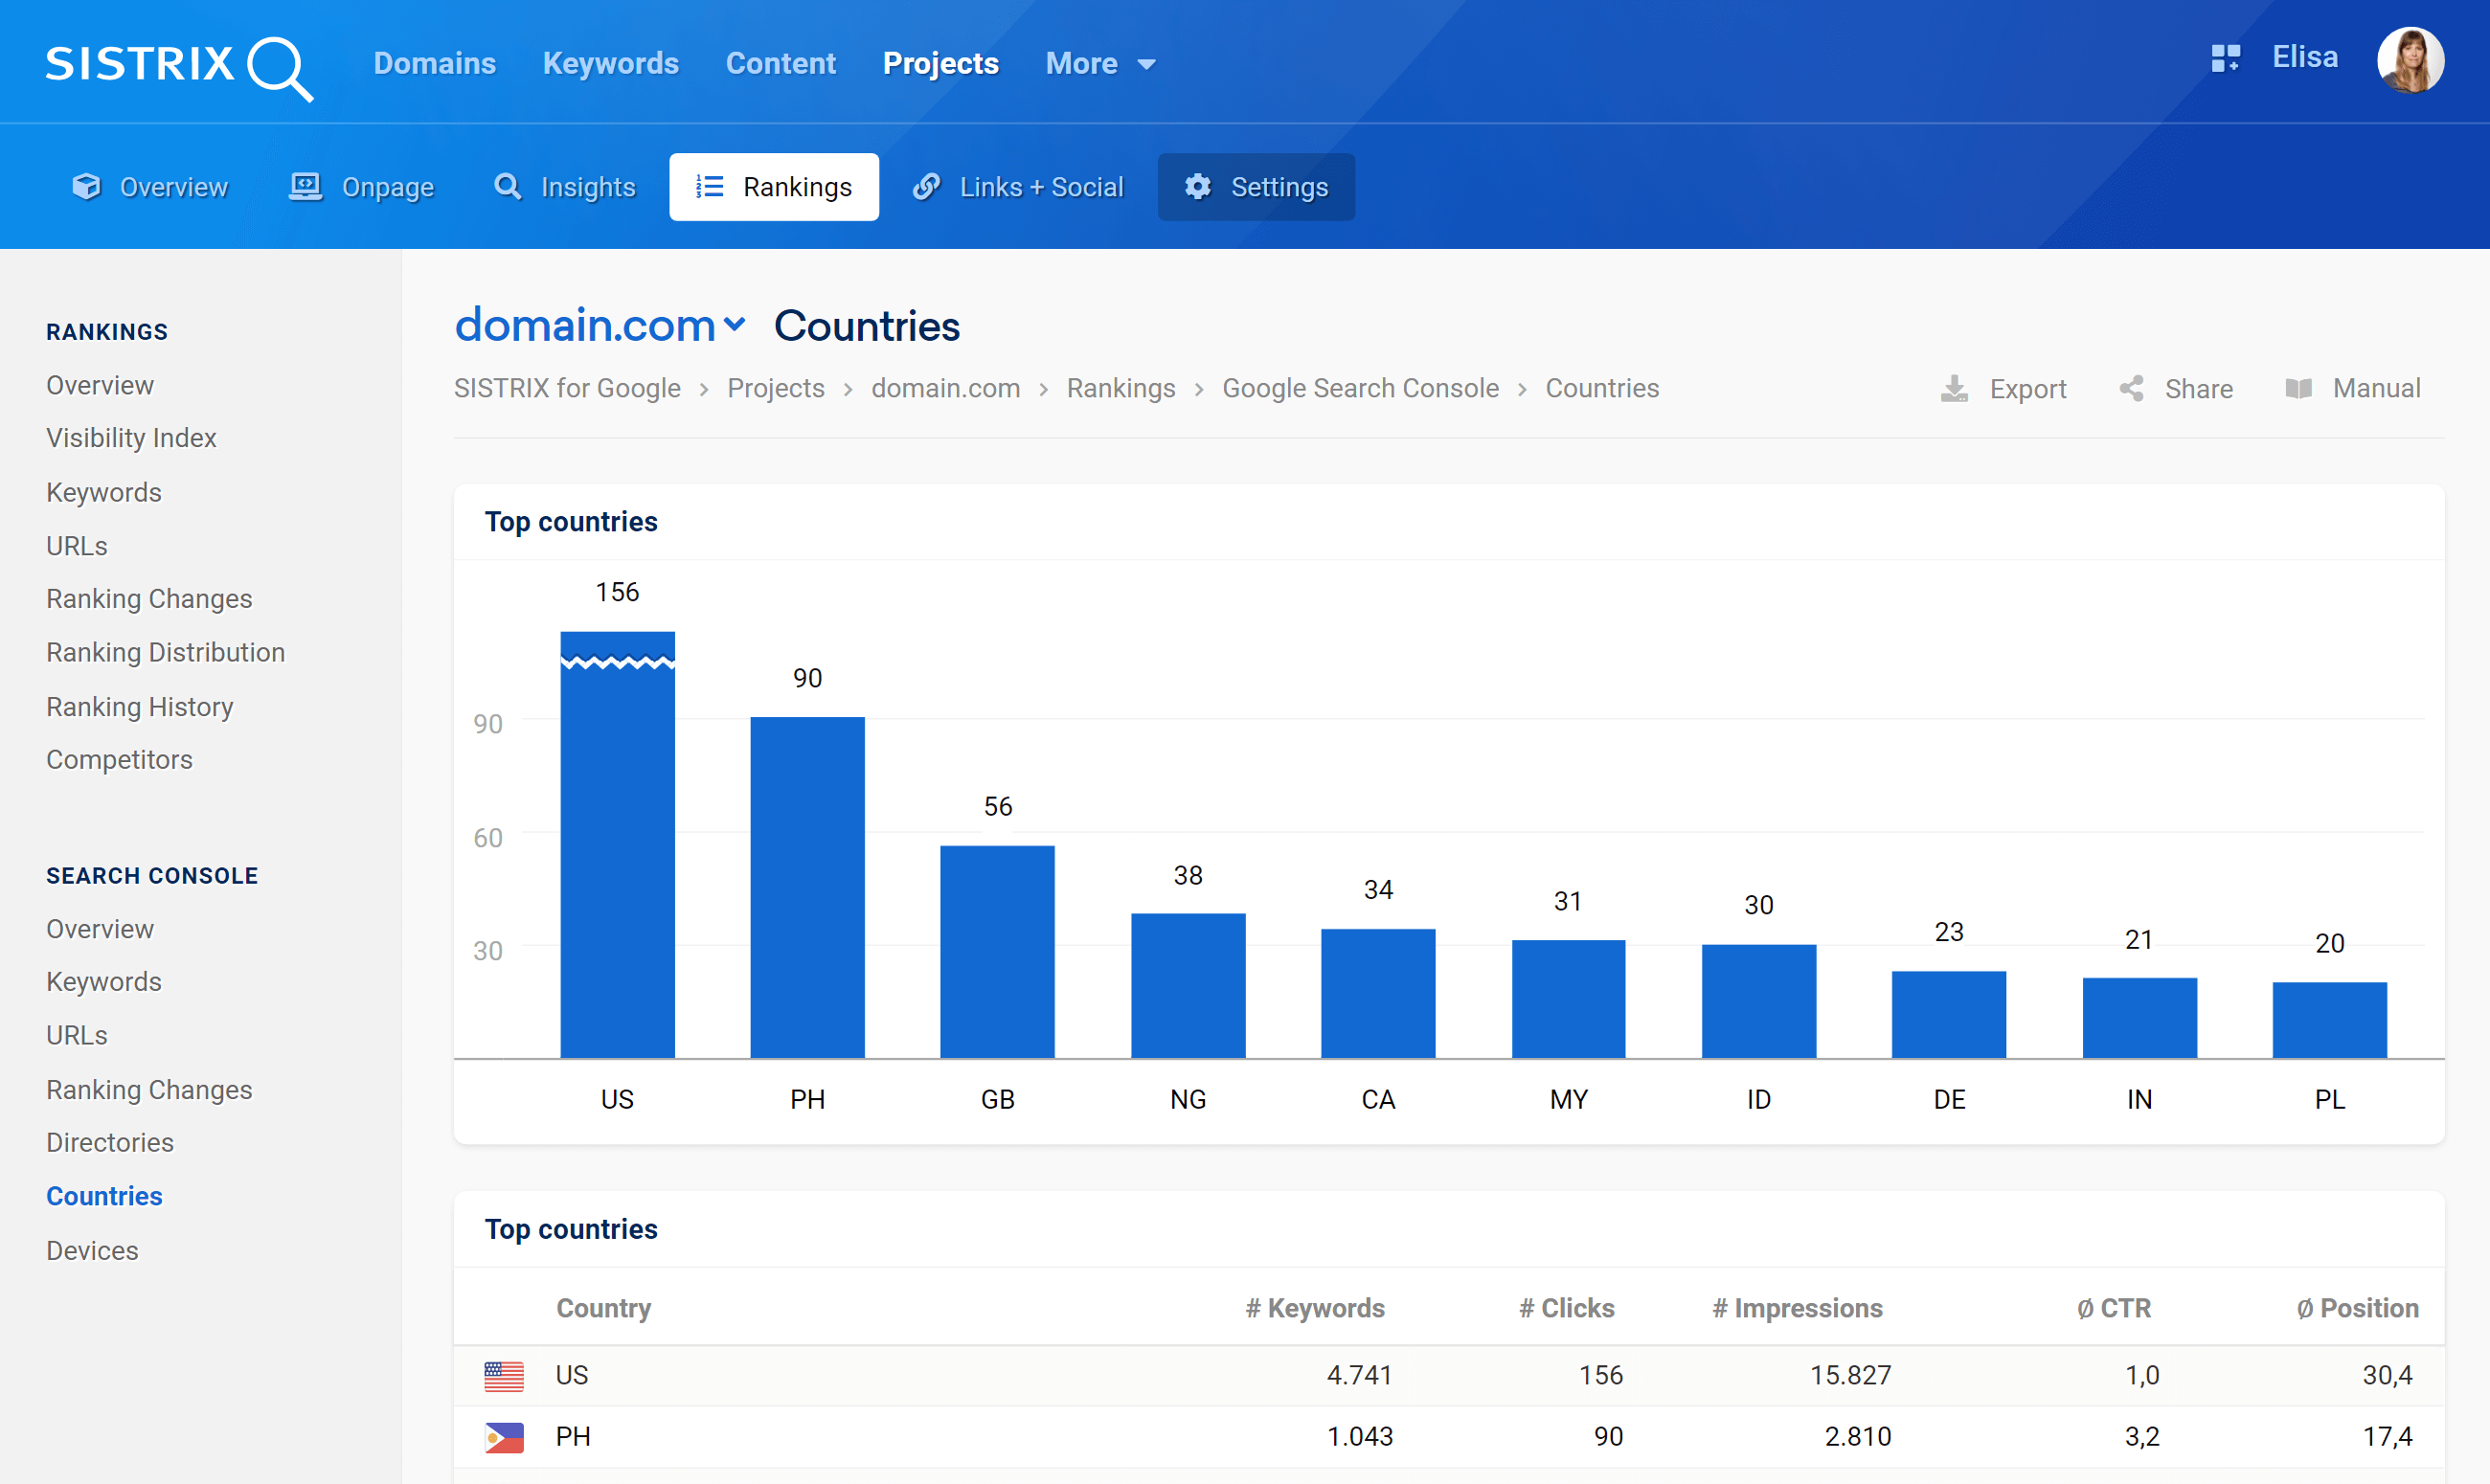
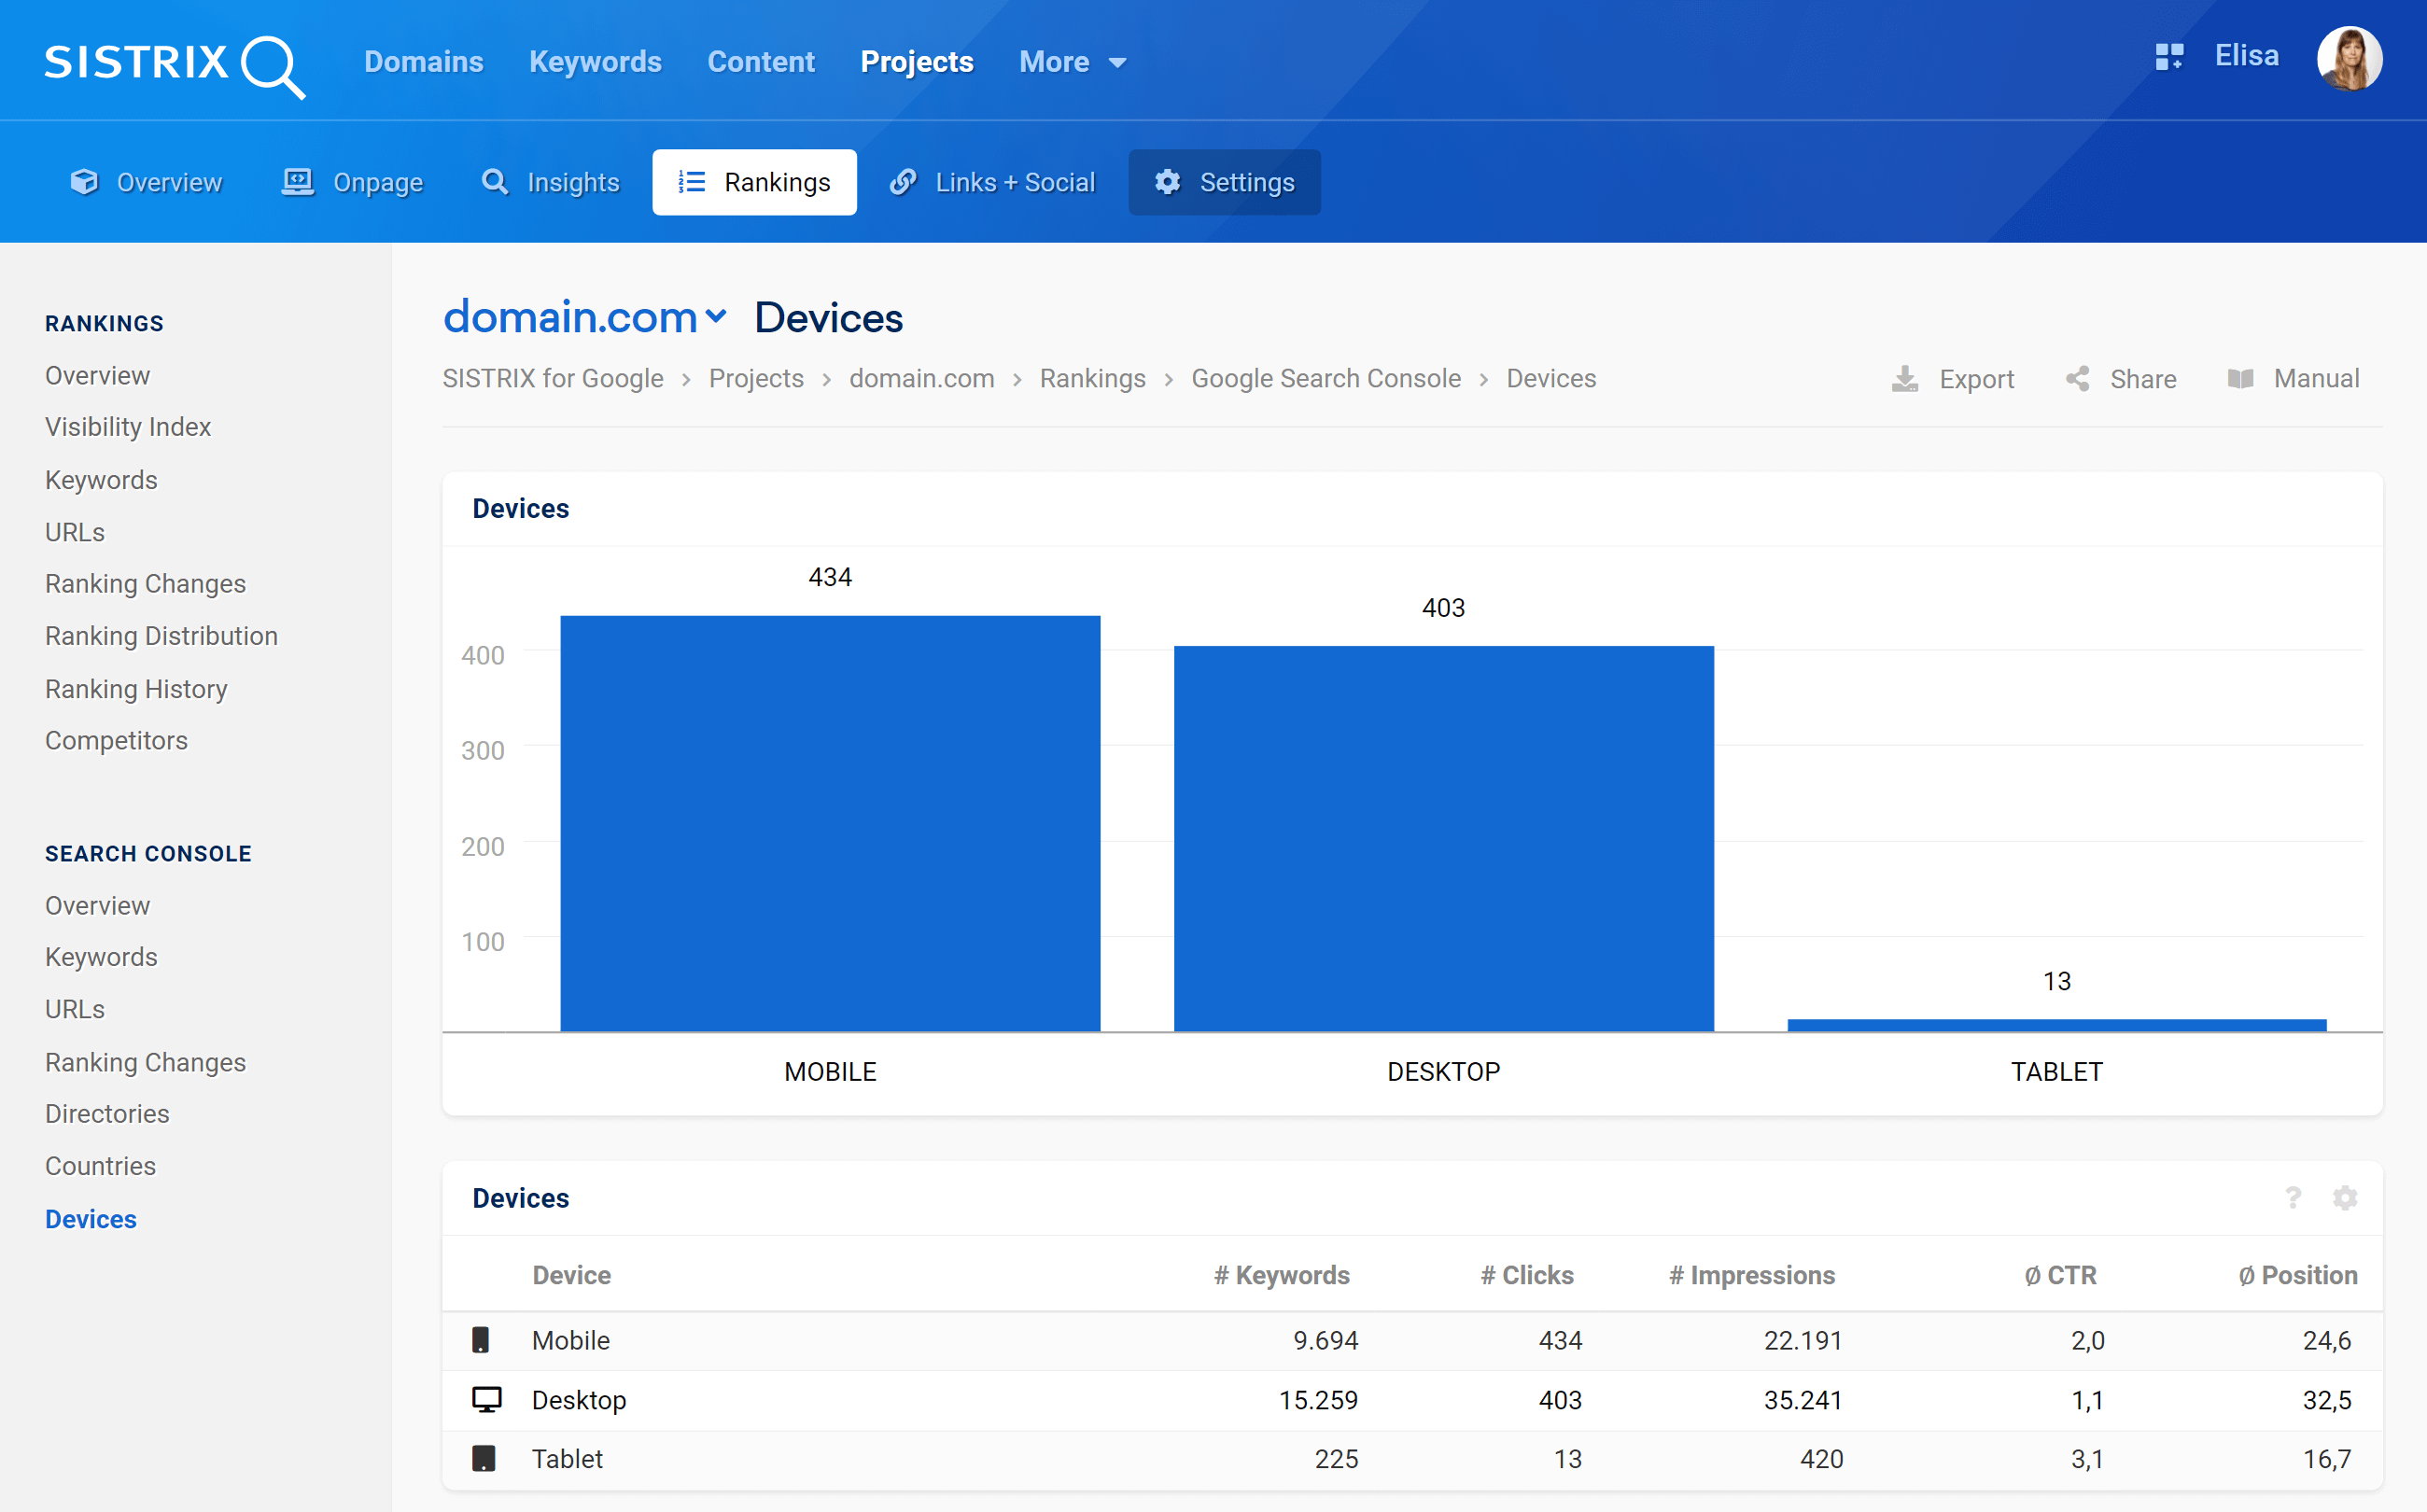
By linking your Google Search Console data to the SISTRIX Toolbox you’ll get interesting insights about your domain’s performance, for example the device which generates more traffic as well as the breakdown by country.
If you linked your websites’ property to the SISTRIX Toolbox, you can access your extended Search Console data within the project and have access to a number of key values from the Google Search Console.
Countries

Bar Chart
This table shows click values across the top countries.
Table
The table here shows click values across the top countries and includes details such as:
- Number of keywords (Across all devices)
- Number of impressions (Appearances in a viewed search page following a user search.)
- Average click-through rate
- Average position across all device types for the period.
The data shown covers a period of 7 days.
Devices

Chart
The chart and table on this page help you to understand which types of device are bringing the most traffic, or are attracting the best CTR rate.
The table shows all data for the device types as defined by Google:
- Desktop
- Mobile
- Tablet
Table
The table here shows more details about the different devices, such as:
- Number of keywords
- Number of clicks and impressions (Appearances in a viewed search page following a user search.)
- Average click-through rate
- Average position.