One of the most flexible and useful ways to compare the history of two or more domains is to use the comparison feature. Compare changes (when you suspect that a competitor or Google might be affecting your domains visibility) or compare mobile vs desktop views.
You are able to display the Visibility Index history for up to 4 domains (or hosts/directories/URLs) together in one graph.
Please type the first domain into the search slot and press enter.
Note: The UK index has historical data since 2010. USA index since 2011. Other countries vary.
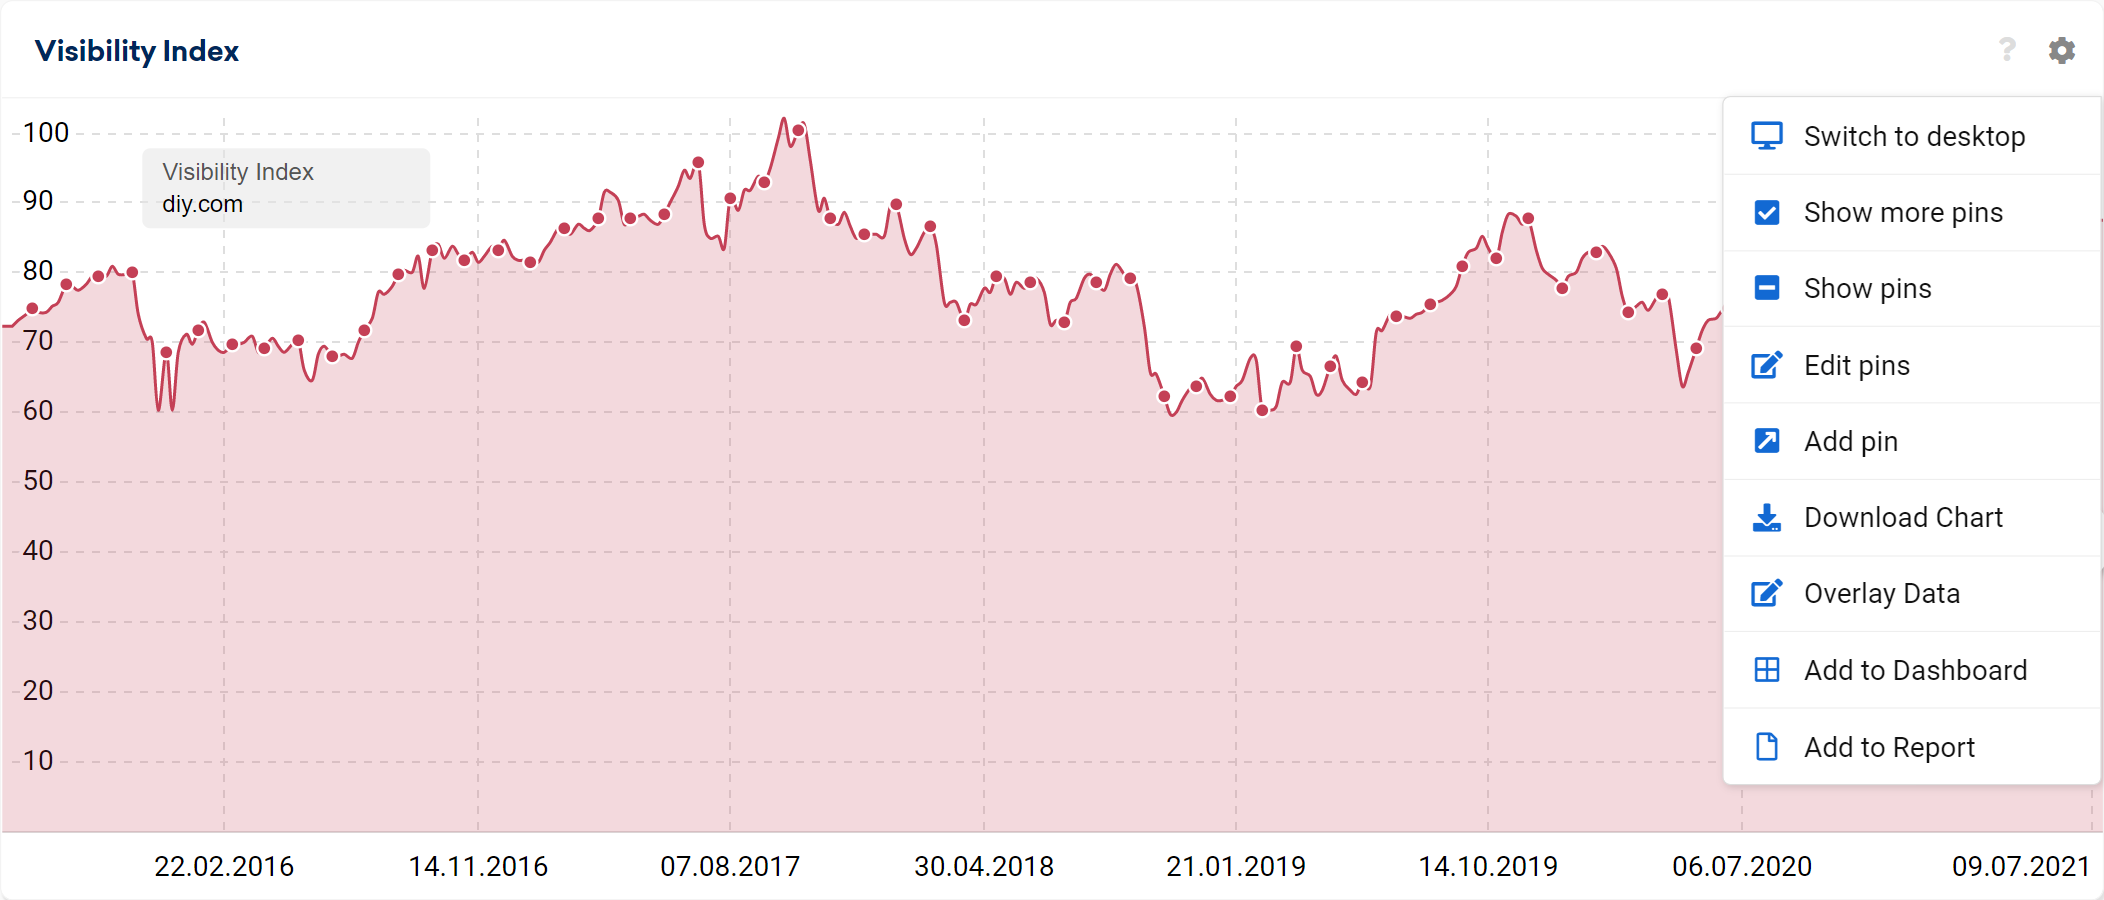
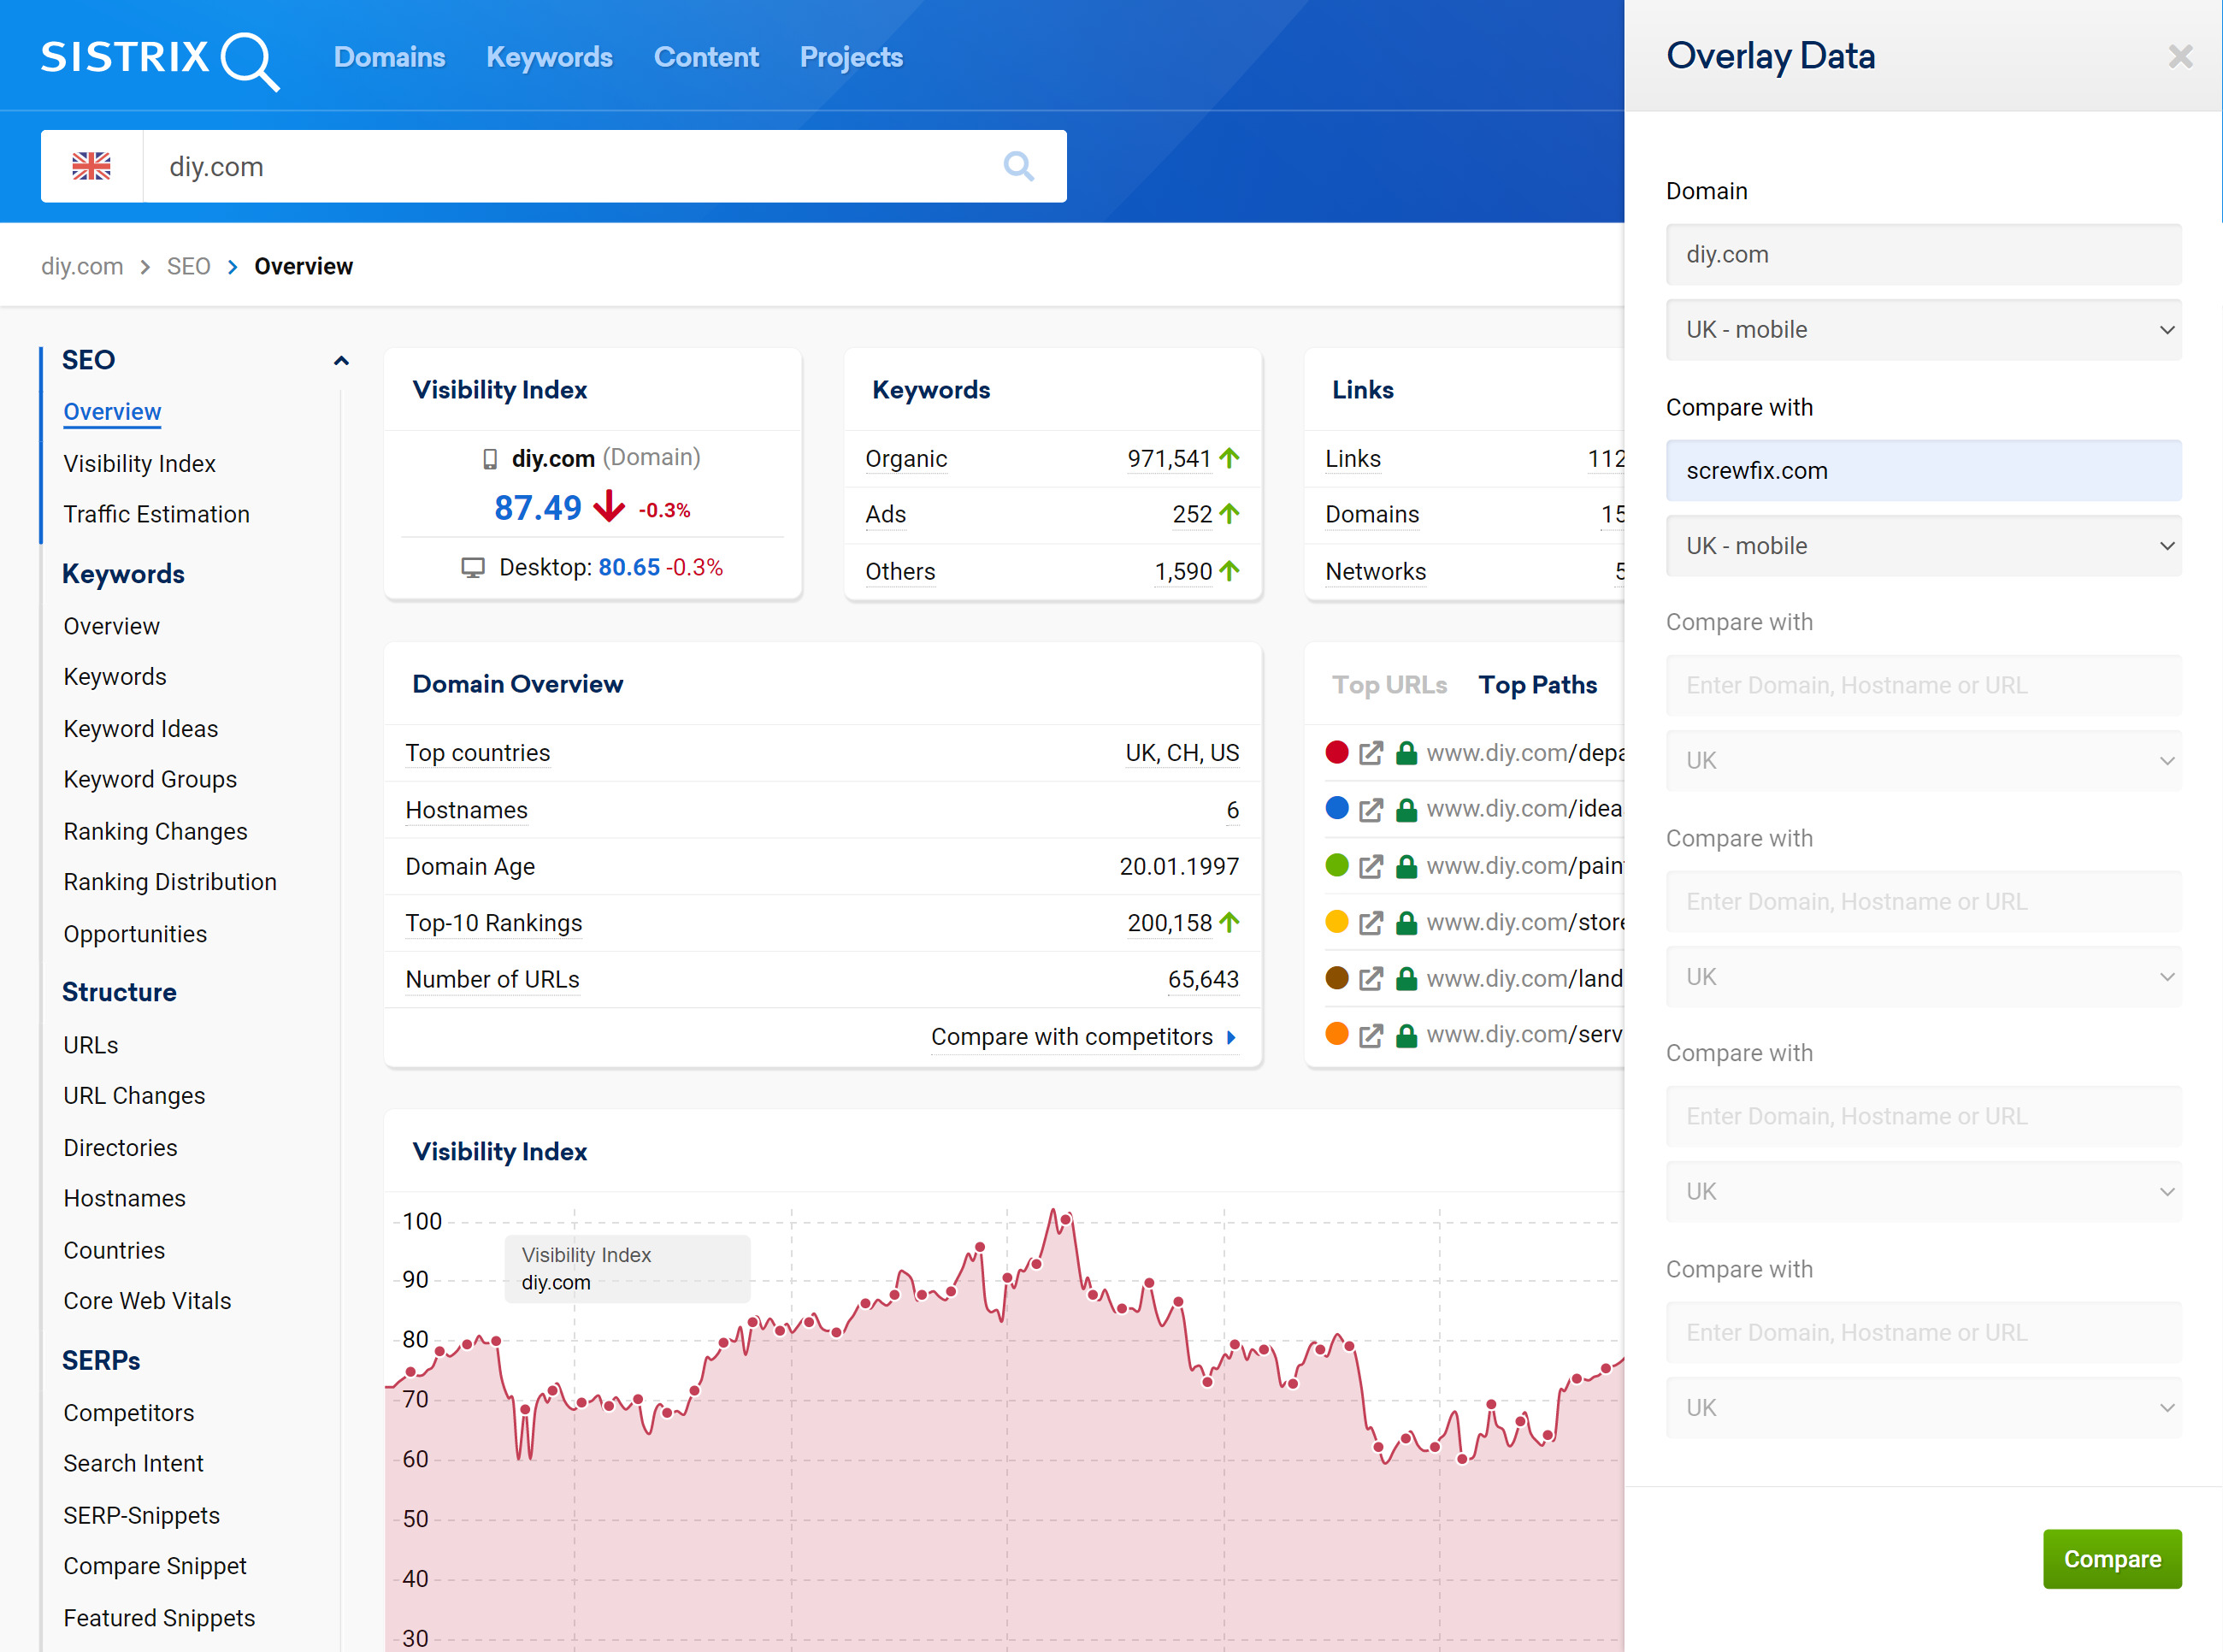
You will be shown the overview page for this domain, complete with the Visibility Index history for the domain. Click on the cogwheel in the upper right corner of the chart and select “Overlay Data”.

At this point, you can enter up to six domains/hosts/directories/URLs whose Visibility Index history you want to superimpose. You can choose any domain and any country including the mobile views.

Please keep in mind the format for the entry of hosts, directories and URLs. You can find these in our FAQ called “Which requests can I start via the search bar?” (Tip: URLS must end with the slash or they will be treated as directories.)
You can zoom into the data as on all the graphs. Left-click your mouse button, drag to the right and then release to zoom.