
Where there are SEO winners, there must also be losers. In 2024, many sites that had previously seen consistent success with driving SEO traffic and visibility saw staggering declines in Google’s U.S. search results.
- What Drove the Greatest Declines?
- March Core & Spam Updates
- Reduced Visibility of Review Content, Enhanced Visibility for UGC & Forums
- Biggest Search Visibility Losses of 2024
- Site Reputation Abuse
- Product Review Sites
- Programmatic SEO & Thin Affiliate Content
- Content-Focused Publications
- Ecommerce
- Travel Blogs & Online Travel Agencies
- Conclusion
- All IndexWatch 2024 reports
- Winners 2024
- Losers 2024
Between various core updates, new spam policies, manual actions, and spam updates, the visibility drops felt by many sites were staggering, particularly in the publishing industry. On the contrary, as discussed in our analysis of the biggest visibility winners in 2024, these losses were often replaced by fast-growing sites featuring user-generated content and forum discussions, such as Reddit, Quora, and Just Answer.
This article is the second of a two-part series and will focus primarily on the biggest visibility losers in 2024.
What Drove the Greatest Declines?
For sites seeing significant visibility declines on Google throughout 2024, the losses generally stemmed from a few important events and changes to search:
March Core & Spam Updates
In March of 2024, Google launched the combined March Core and Spam Updates, the longest and biggest core update in its history. With these updates, Google originally intended to remove 40% of “unhelpful” content from the search results, but Google claimed that figure was closer to 45%. Google significantly lowered the rankings of websites it deemed to be focused more on optimizing for search engines than on providing genuine value to human readers.
Alongside the core update, Google introduced 3 new spam policies in March 2024: site reputation abuse, scaled content abuse, and expired domain abuse. These policies aimed to demote the visibility of sites engaged in egregious spam behaviors that violate Google’s content guidelines. Affected site owners received manual actions from Google’s webspam team, beginning in March and continuing throughout the year.
Many of the biggest visibility losers in 2024 saw dramatic declines resulting from these joint updates, as will be demonstrated with several visibility charts throughout the article.
Reduced Visibility of Review Content, Enhanced Visibility for UGC & Forums
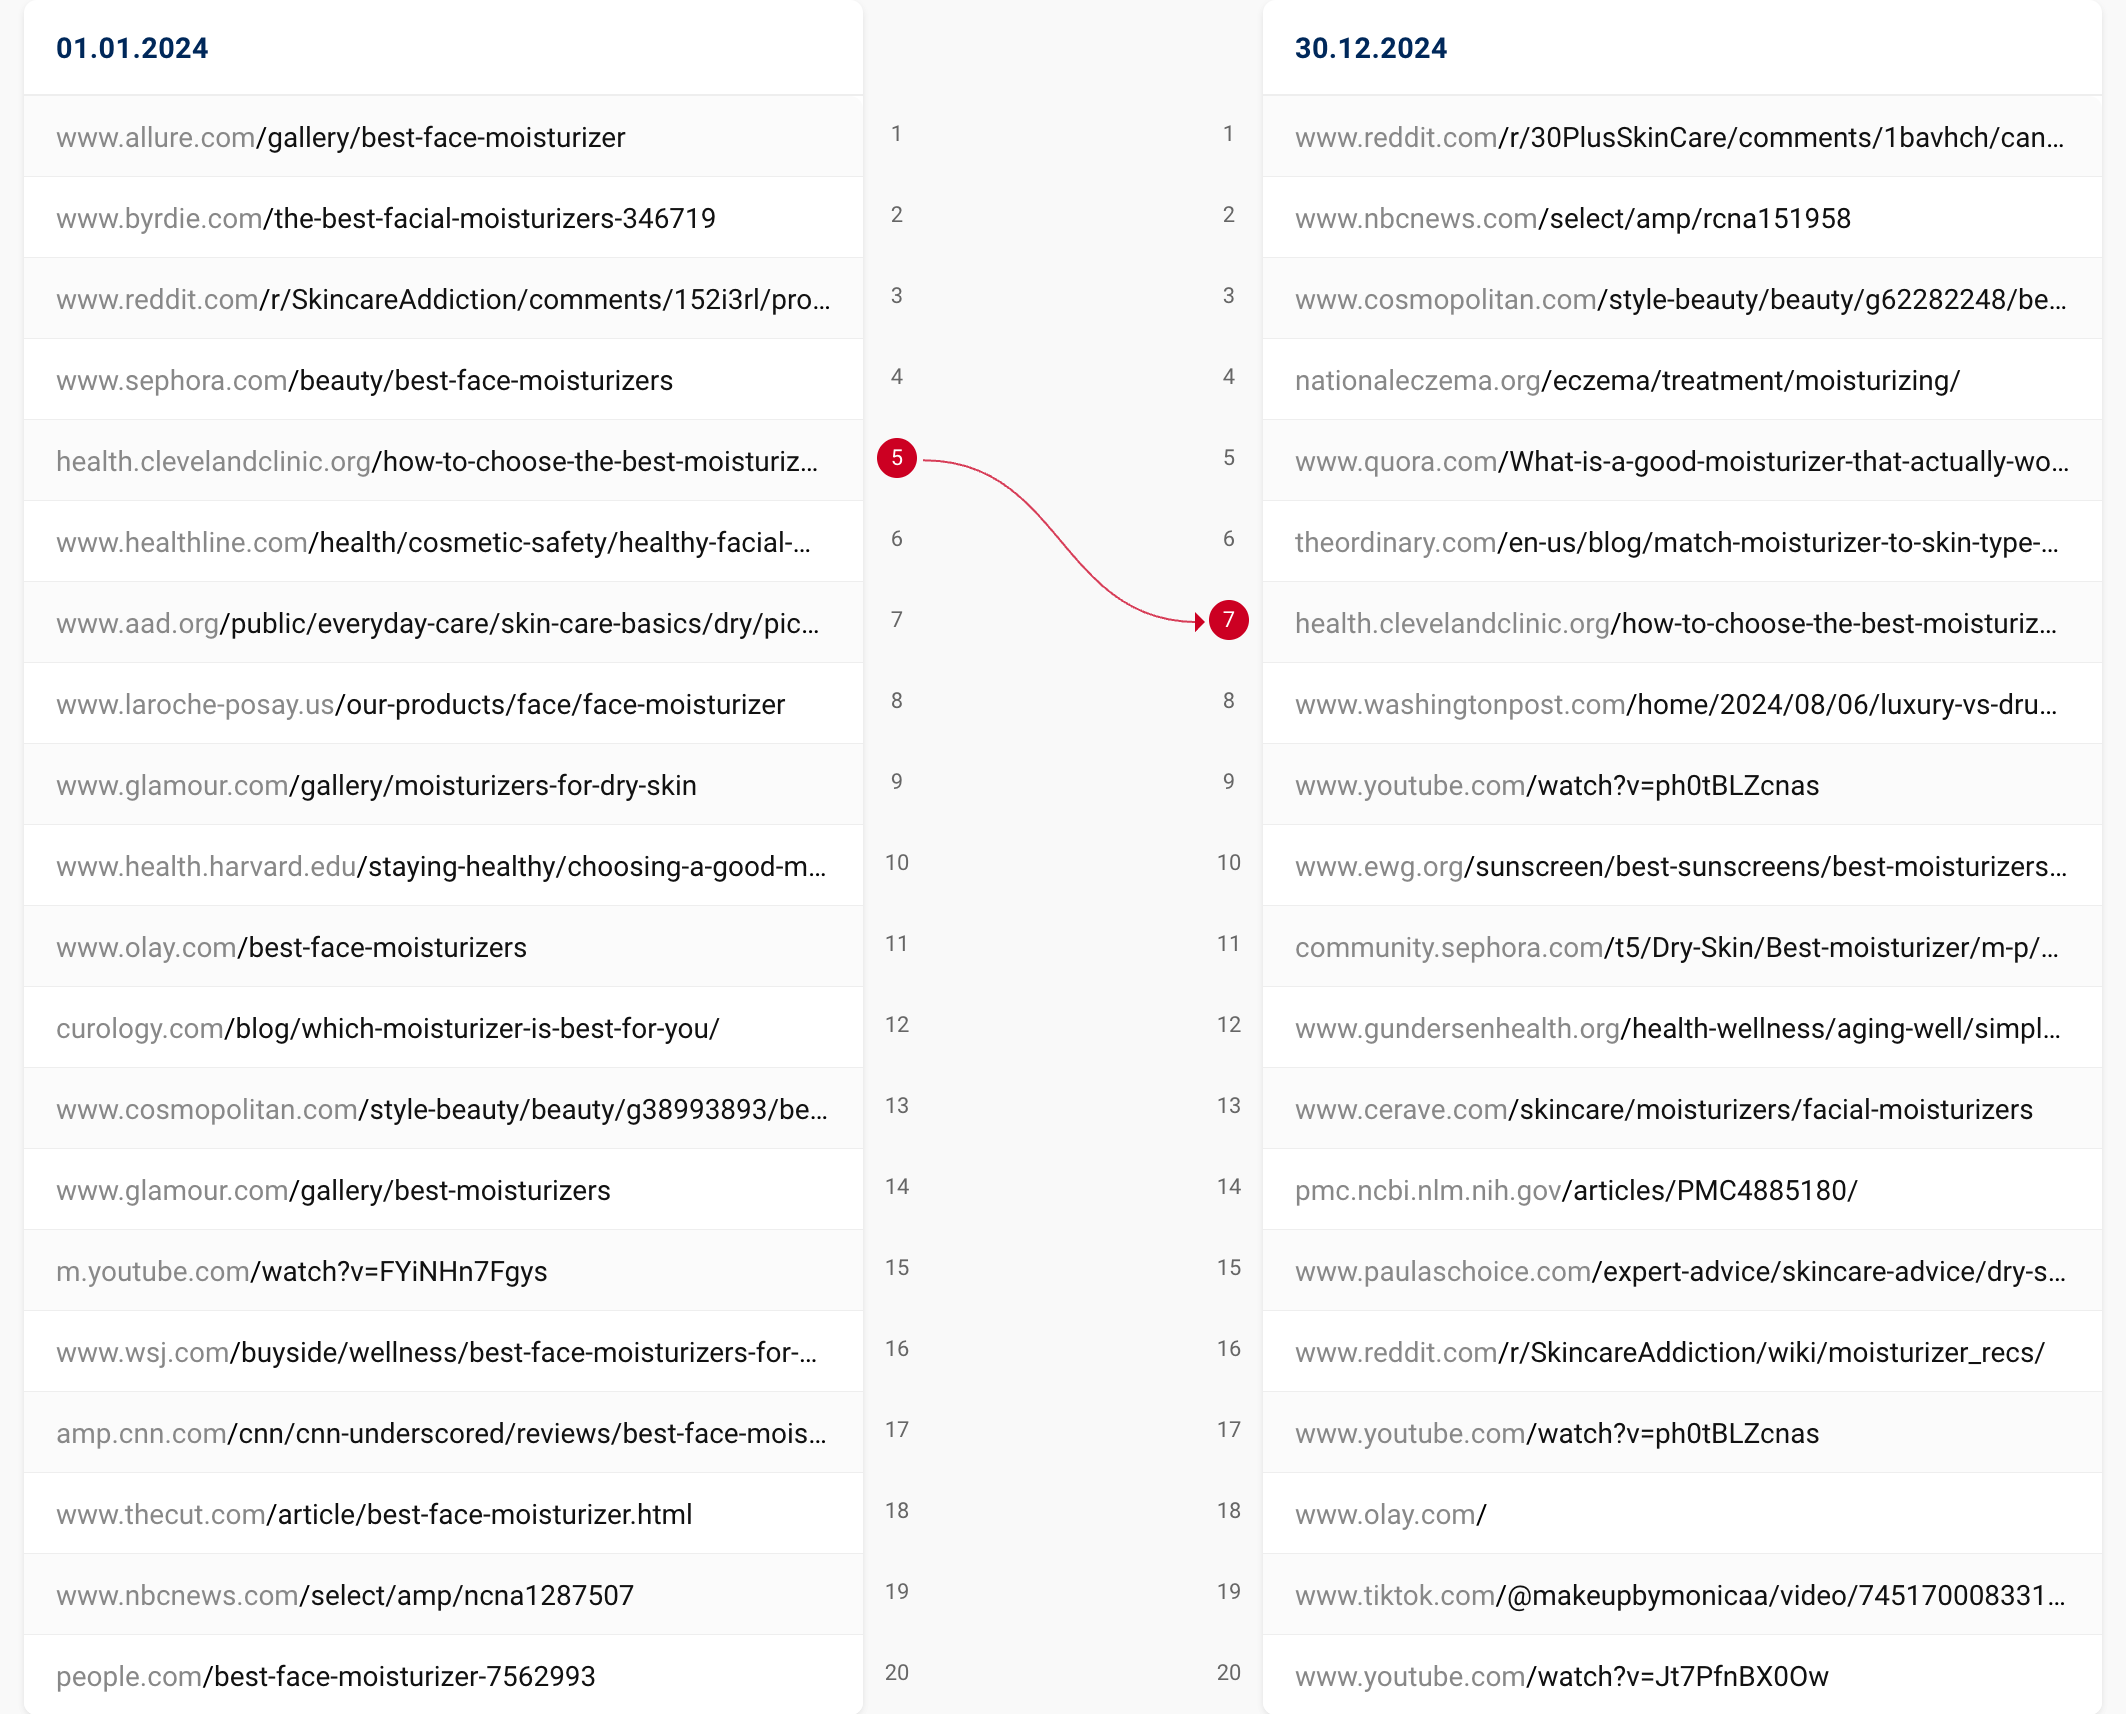
One major trend throughout 2024 was that many sites focused on product reviews saw visibility decline across the board. This may be due to Google increasing the visibility of real-life conversations on forum sites like Reddit and Quora replacing the top rankings previously held by product review articles. Below is an example for how the SERP changed for the keyword “best moisturizer” throughout the year – Reddit took the #1 position, and Quora moved into position 5 after not ranking in the top 10. While this change to the SERP landscape seems subtle, the impact is significant at scale across thousands of product review sites.
Biggest Search Visibility Losses of 2024
Listed below are the top 100 losing domains of 2024 in US search followed by sector-by-sector analysis.
Percentage decreases:
| Domain | 1st Jan 2024 | 30th Dec 2024 | Change |
|---|---|---|---|
| vudu.com | 6.99 | 0.11 | -98.45% |
| timesofindia.com | 9.99 | 0.25 | -97.45% |
| point2homes.com | 6.28 | 0.19 | -97.00% |
| hbomax.com | 3.15 | 0.13 | -95.78% |
| outlookindia.com | 3.60 | 0.15 | -95.75% |
| publicschoolreview.com | 3.12 | 0.14 | -95.59% |
| stlyrics.com | 5.28 | 0.28 | -94.74% |
| luxuryhotel.world | 3.55 | 0.20 | -94.25% |
| everand.com | 3.41 | 0.21 | -93.72% |
| tubesafari.com | 3.28 | 0.24 | -92.63% |
| autoblog.com | 9.82 | 0.76 | -92.29% |
| stylecraze.com | 3.35 | 0.29 | -91.23% |
| thewindowsclub.com | 3.53 | 0.32 | -91.04% |
| videoconverterfactory.com | 5.91 | 0.57 | -90.37% |
| softwaretestinghelp.com | 5.71 | 0.59 | -89.68% |
| vacourts.gov | 3.33 | 0.34 | -89.66% |
| depositphotos.com | 9.19 | 0.98 | -89.32% |
| lyricsfreak.com | 4.55 | 0.49 | -89.19% |
| planetware.com | 3.54 | 0.39 | -89.00% |
| propertyshark.com | 5.72 | 0.65 | -88.69% |
| newworldencyclopedia.org | 11.10 | 1.28 | -88.47% |
| secondhandsongs.com | 4.70 | 0.56 | -88.00% |
| softwarekeep.com | 3.37 | 0.42 | -87.61% |
| womansday.com | 10.90 | 1.37 | -87.46% |
| expertphotography.com | 3.22 | 0.41 | -87.39% |
| independent.co.uk | 22.11 | 2.89 | -86.91% |
| clarks.com | 12.02 | 1.67 | -86.13% |
| wallstreetmojo.com | 3.20 | 0.48 | -84.95% |
| theculturetrip.com | 4.54 | 0.69 | -84.90% |
| wikiwand.com | 8.71 | 1.36 | -84.42% |
| allthatsinteresting.com | 3.74 | 0.58 | -84.38% |
| lyricstranslate.com | 5.00 | 0.78 | -84.38% |
| sarahmaker.com | 3.55 | 0.55 | -84.37% |
| hostingadvice.com | 3.62 | 0.57 | -84.28% |
| oberlo.com | 5.72 | 0.92 | -83.91% |
| momjunction.com | 6.84 | 1.12 | -83.57% |
| usa.com | 4.71 | 0.78 | -83.52% |
| fluentu.com | 4.93 | 0.84 | -82.89% |
| guru99.com | 10.30 | 1.79 | -82.57% |
| spokeo.com | 4.56 | 0.80 | -82.44% |
| a-z-animals.com | 11.23 | 1.97 | -82.42% |
| valuepenguin.com | 3.34 | 0.59 | -82.41% |
| signupgenius.com | 4.28 | 0.77 | -82.00% |
| upcounsel.com | 3.71 | 0.68 | -81.80% |
| computerworld.com | 6.34 | 1.18 | -81.38% |
| foursquare.com | 4.84 | 0.91 | -81.15% |
| seventeen.com | 4.44 | 0.84 | -81.14% |
| getapp.com | 3.74 | 0.71 | -81.06% |
| money.com | 6.57 | 1.26 | -80.88% |
| wynk.in | 9.41 | 1.84 | -80.45% |
| mirror.co.uk | 6.38 | 1.25 | -80.44% |
| techopedia.com | 10.80 | 2.12 | -80.37% |
| thomasnet.com | 5.13 | 1.01 | -80.31% |
| acouplecooks.com | 4.48 | 0.90 | -79.84% |
| sitejabber.com | 5.47 | 1.12 | -79.50% |
| cafedelites.com | 6.89 | 1.44 | -79.08% |
| thrillist.com | 3.76 | 0.79 | -79.07% |
| grammarist.com | 5.59 | 1.17 | -79.03% |
| oprahdaily.com | 9.72 | 2.08 | -78.66% |
| townandcountrymag.com | 9.30 | 2.03 | -78.19% |
| twitter.com | 291.58 | 63.97 | -78.06% |
| popsci.com | 3.58 | 0.80 | -77.56% |
| songlyrics.com | 14.82 | 3.34 | -77.45% |
| carsforsale.com | 4.14 | 0.95 | -76.99% |
| blackpast.org | 3.07 | 0.71 | -76.91% |
| avenue.com | 3.02 | 0.71 | -76.42% |
| zippia.com | 11.59 | 2.74 | -76.38% |
| tcm.com | 16.73 | 4.00 | -76.07% |
| feedspot.com | 3.41 | 0.82 | -75.96% |
| makeuseof.com | 22.91 | 5.51 | -75.95% |
| oyster.com | 4.50 | 1.10 | -75.64% |
| movieweb.com | 8.00 | 1.96 | -75.48% |
| lovetoknow.com | 8.35 | 2.06 | -75.37% |
| gorjana.com | 3.74 | 0.93 | -75.13% |
| shotkit.com | 4.27 | 1.07 | -75.04% |
| knowyourmeme.com | 4.08 | 1.02 | -75.01% |
| rockethomes.com | 12.00 | 3.02 | -74.85% |
| dogbreedinfo.com | 3.23 | 0.81 | -74.80% |
| zoominfo.com | 9.19 | 2.33 | -74.68% |
| bestproducts.com | 4.23 | 1.08 | -74.54% |
| betterup.com | 10.87 | 2.84 | -73.93% |
| fastpeoplesearch.com | 3.41 | 0.89 | -73.80% |
| betterteam.com | 3.62 | 0.95 | -73.78% |
| comparitech.com | 3.15 | 0.83 | -73.70% |
| esquire.com | 11.55 | 3.06 | -73.54% |
| digitaltrends.com | 18.97 | 5.03 | -73.51% |
| everydayhealth.com | 16.11 | 4.27 | -73.48% |
| timesunion.com | 3.98 | 1.06 | -73.38% |
| lyst.com | 7.59 | 2.03 | -73.20% |
| hdtvsolutions.com | 3.36 | 0.90 | -73.15% |
| mtv.com | 6.63 | 1.78 | -73.13% |
| cheapair.com | 4.62 | 1.24 | -73.13% |
| agame.com | 7.49 | 2.02 | -72.98% |
| ldoceonline.com | 27.60 | 7.51 | -72.79% |
| dailypaws.com | 5.88 | 1.61 | -72.62% |
| chron.com | 17.18 | 4.73 | -72.49% |
| theatlantic.com | 12.12 | 3.36 | -72.33% |
| familydoctor.org | 7.40 | 2.05 | -72.32% |
| temu.com | 3.22 | 0.90 | -72.14% |
| g2.com | 17.09 | 4.77 | -72.10% |
Absolute decreases:
| Domain | 1st Jan 2024 | 30th Dec 2024 | Change |
|---|---|---|---|
| twitter.com | 291.58 | 63.97 | -227.61 |
| google.com | 726.00 | 555.90 | -170.10 |
| dictionary.com | 551.80 | 404.61 | -147.19 |
| bestbuy.com | 431.02 | 308.08 | -122.95 |
| collinsdictionary.com | 314.96 | 196.83 | -118.13 |
| forbes.com | 174.11 | 65.29 | -108.82 |
| britannica.com | 746.87 | 639.69 | -107.18 |
| linkedin.com | 389.69 | 308.16 | -81.53 |
| target.com | 336.33 | 255.44 | -80.89 |
| walmart.com | 570.14 | 493.66 | -76.48 |
| nerdwallet.com | 120.06 | 50.51 | -69.55 |
| webmd.com | 260.53 | 194.34 | -66.19 |
| homedepot.com | 432.18 | 368.72 | -63.46 |
| hotels.com | 224.53 | 161.77 | -62.76 |
| investopedia.com | 236.94 | 177.33 | -59.61 |
| usnews.com | 245.36 | 185.88 | -59.47 |
| etsy.com | 178.16 | 120.88 | -57.28 |
| kayak.com | 158.16 | 102.05 | -56.11 |
| cdc.gov | 176.66 | 123.12 | -53.54 |
| techtarget.com | 109.81 | 57.06 | -52.76 |
| amazon.com | 2967.78 | 2915.32 | -52.46 |
| indeed.com | 296.87 | 244.69 | -52.17 |
| goodhousekeeping.com | 76.01 | 26.82 | -49.19 |
| macys.com | 106.08 | 57.57 | -48.51 |
| vocabulary.com | 261.05 | 215.95 | -45.10 |
| nih.gov | 404.32 | 360.86 | -43.45 |
| hubspot.com | 59.22 | 18.28 | -40.93 |
| wikihow.com | 90.78 | 51.22 | -39.56 |
| lifewire.com | 66.65 | 27.21 | -39.44 |
| pinterest.com | 409.46 | 370.98 | -38.48 |
| newegg.com | 86.78 | 48.83 | -37.96 |
| xnxx.com | 56.34 | 18.69 | -37.66 |
| lowes.com | 155.54 | 118.20 | -37.34 |
| cnet.com | 121.05 | 84.00 | -37.05 |
| healthline.com | 203.01 | 166.40 | -36.61 |
| wayfair.com | 80.36 | 46.49 | -33.87 |
| cnbc.com | 62.84 | 29.16 | -33.68 |
| cornell.edu | 105.09 | 74.46 | -30.63 |
| lyrics.com | 41.38 | 12.55 | -28.83 |
| nytimes.com | 193.60 | 165.58 | -28.03 |
| thesaurus.com | 108.50 | 80.78 | -27.72 |
| nordstrom.com | 112.42 | 85.18 | -27.23 |
| bankrate.com | 80.66 | 54.06 | -26.60 |
| delish.com | 38.00 | 11.98 | -26.02 |
| time.com | 37.43 | 11.53 | -25.89 |
| pcmag.com | 101.15 | 75.31 | -25.84 |
| people.com | 69.40 | 43.90 | -25.51 |
| usatoday.com | 72.47 | 47.59 | -24.88 |
| bedbathandbeyond.com | 37.47 | 12.91 | -24.55 |
| bhphotovideo.com | 70.57 | 46.12 | -24.46 |
| niche.com | 66.15 | 41.69 | -24.45 |
| timeout.com | 40.01 | 16.04 | -23.97 |
| travelandleisure.com | 38.63 | 14.71 | -23.92 |
| theguardian.com | 78.57 | 55.25 | -23.32 |
| kohls.com | 38.38 | 16.50 | -21.88 |
| nationalgeographic.com | 58.83 | 36.96 | -21.87 |
| southernliving.com | 39.77 | 18.06 | -21.71 |
| metacritic.com | 43.59 | 21.97 | -21.62 |
| cnn.com | 73.48 | 52.46 | -21.02 |
| yourdictionary.com | 41.10 | 20.77 | -20.33 |
| ldoceonline.com | 27.60 | 7.51 | -20.09 |
| independent.co.uk | 22.11 | 2.89 | -19.22 |
| travelocity.com | 58.80 | 39.79 | -19.01 |
| unsplash.com | 102.64 | 83.76 | -18.89 |
| foodnetwork.com | 45.61 | 27.31 | -18.31 |
| trulia.com | 80.86 | 62.73 | -18.13 |
| themoviedb.org | 30.59 | 12.59 | -18.01 |
| azlyrics.com | 72.49 | 55.08 | -17.41 |
| countryliving.com | 26.54 | 9.14 | -17.40 |
| makeuseof.com | 22.91 | 5.51 | -17.40 |
| booking.com | 180.04 | 162.86 | -17.18 |
| nationalgeographic.org | 38.87 | 21.80 | -17.08 |
| lonelyplanet.com | 43.57 | 26.81 | -16.76 |
| movoto.com | 26.76 | 10.50 | -16.26 |
| songfacts.com | 24.12 | 7.90 | -16.22 |
| cntraveler.com | 36.23 | 20.03 | -16.21 |
| pbs.org | 55.28 | 39.14 | -16.14 |
| remax.com | 37.43 | 21.44 | -15.99 |
| samhsa.gov | 28.71 | 12.98 | -15.73 |
| wsj.com | 23.98 | 8.45 | -15.53 |
| tvguide.com | 41.75 | 26.22 | -15.53 |
| loc.gov | 54.38 | 38.87 | -15.51 |
| jcpenney.com | 24.04 | 8.75 | -15.29 |
| nyc.gov | 57.00 | 42.03 | -14.97 |
| barnesandnoble.com | 53.00 | 38.06 | -14.94 |
| rd.com | 22.00 | 7.20 | -14.80 |
| crunchbase.com | 29.54 | 14.80 | -14.75 |
| visittheusa.com | 31.59 | 17.53 | -14.06 |
| digitaltrends.com | 18.97 | 5.03 | -13.95 |
| rollingstone.com | 31.15 | 17.23 | -13.92 |
| reuters.com | 31.03 | 17.13 | -13.89 |
| wired.com | 30.56 | 16.91 | -13.66 |
| cheapflights.com | 24.57 | 11.02 | -13.55 |
| ancestry.com | 40.08 | 26.58 | -13.50 |
| bloomberg.com | 33.41 | 20.00 | -13.41 |
| medicalnewstoday.com | 105.90 | 92.67 | -13.23 |
| cars.com | 47.46 | 34.32 | -13.14 |
| architecturaldigest.com | 19.57 | 6.67 | -12.90 |
| tcm.com | 16.73 | 4.00 | -12.73 |
| songmeanings.com | 26.97 | 14.26 | -12.72 |
Site Reputation Abuse
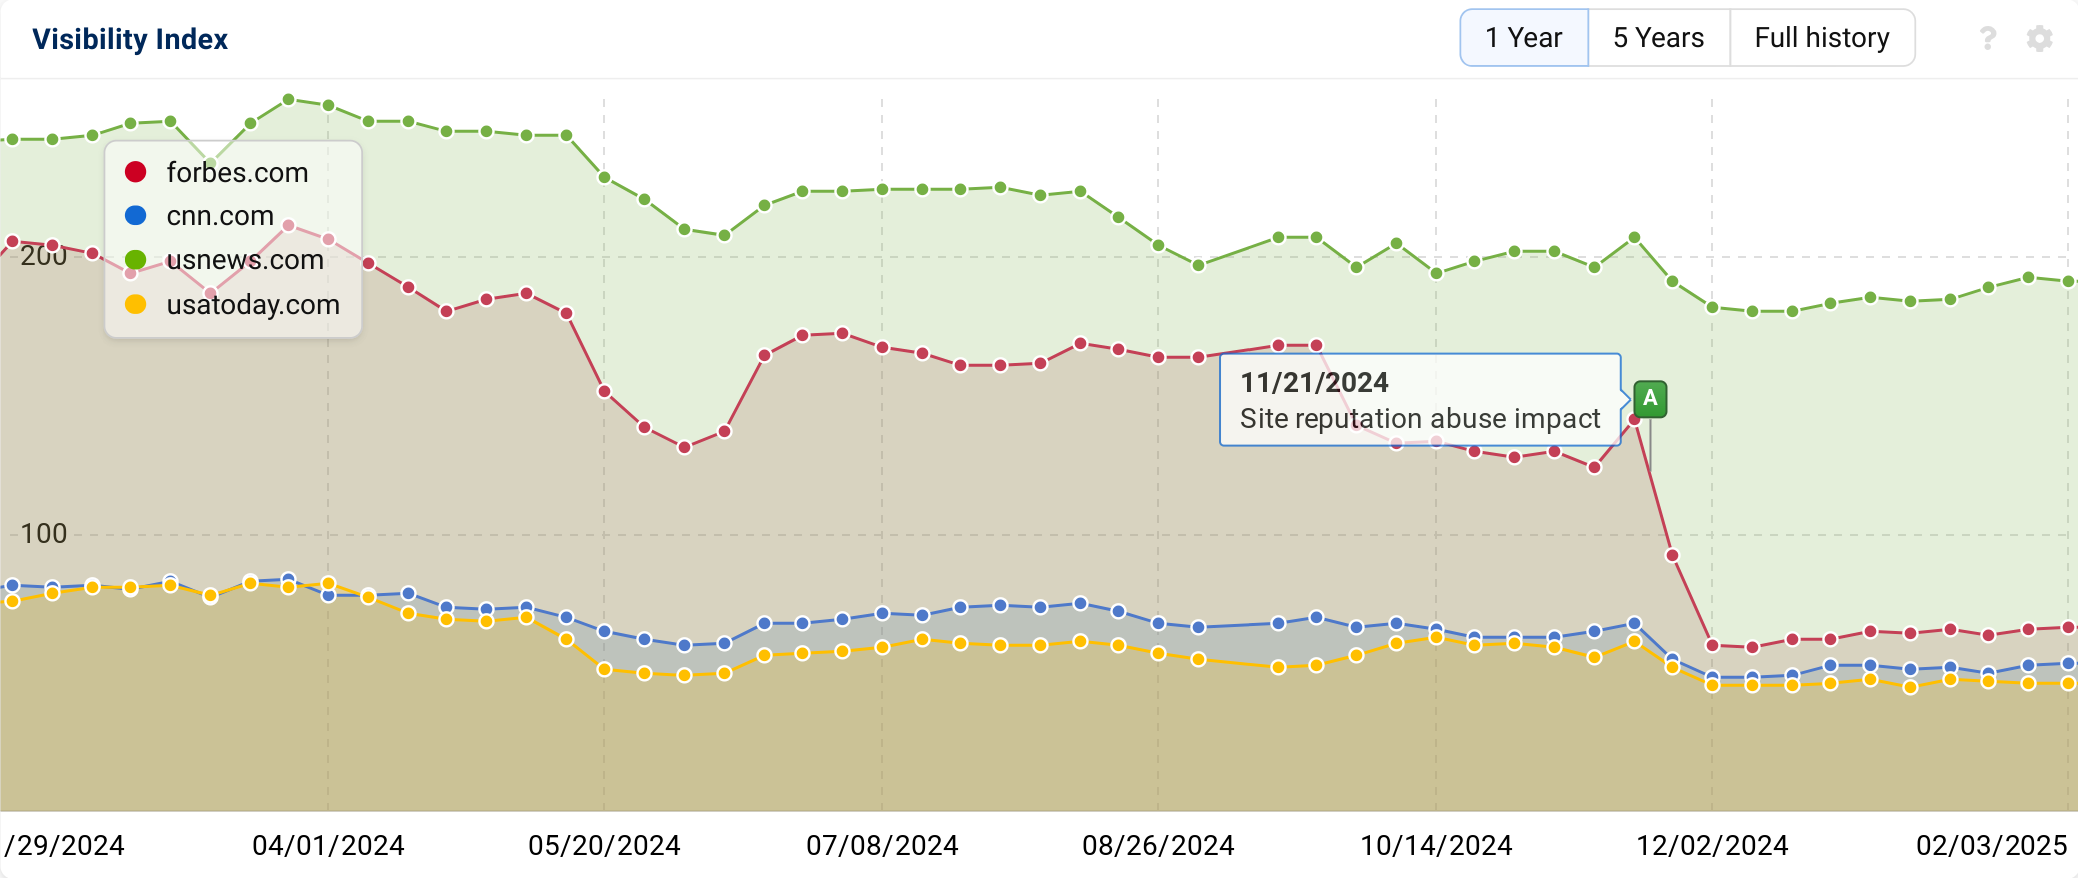
Google sent manual actions for Site Reputation Abuse on November 19, 2024. According to Google, “Site Reputation Abuse is a tactic where third-party content is published on a host site in an attempt to take advantage of the host’s already-established ranking signals.” While there is no way to confirm externally that a site received a manual action without seeing that site’s own Google Search Console account, several notable sites saw dramatic visibility declines on this date for subfolders and subdomains that fit the definition of what Google was looking to demote in search.
By looking at the greatest absolute losers in the “Movers and Shakers” report across the dates November 17 to November 24, 2024, you can see several sites impacted by these manual actions:

Overlaying the visibility of several affected sites during this window reveals several large publishers who saw significant visibility declines starting on November 19, 2024:
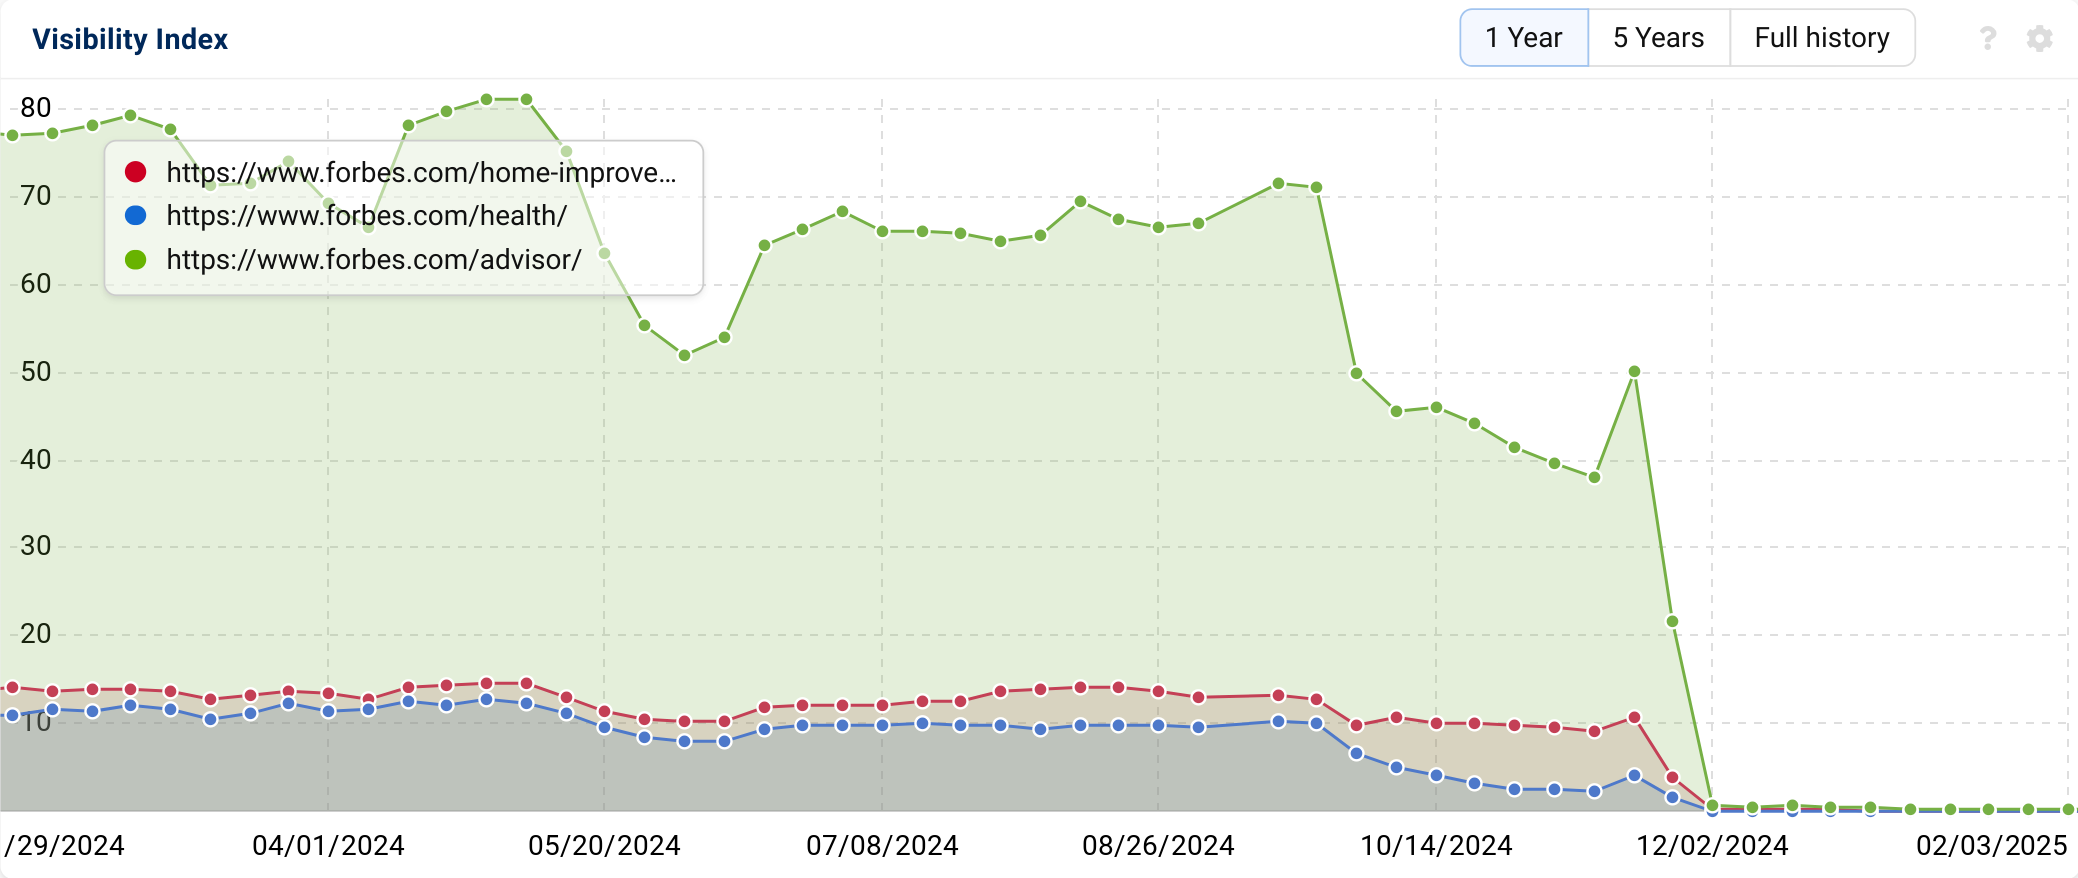
Drilling down into specific subfolders on Forbes.com reveals how visibility dropped to 0 across its /advisor/, /health/, and /home-improvement/ subfolders in the days after the Site Reputation Abuse manual actions were sent out by Google.
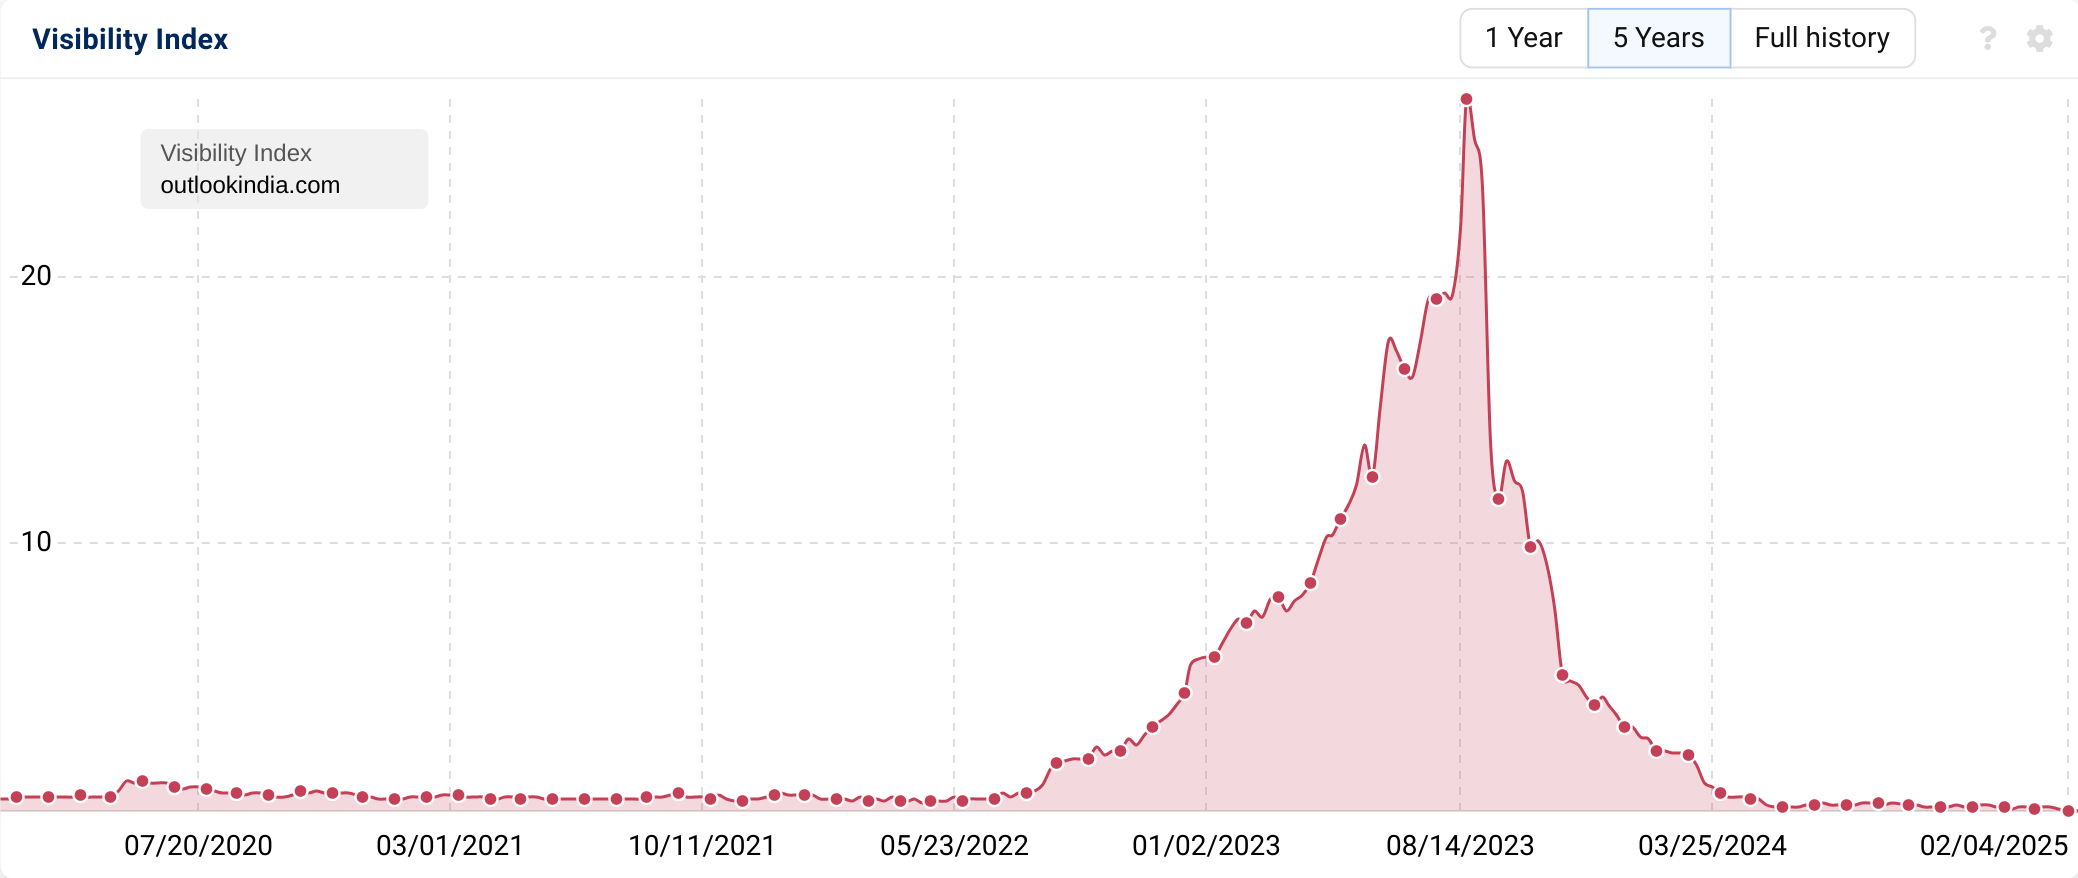
Another site on the loser list that was notorious in the SEO industry for accepting sponsored posts (a potential form of site reputation abuse) is OutlookIndia.com. While its greatest visibility decline took place in September 2023, the trend continued throughout 2024, with another major drop occurring during the March Core and Spam Updates.
Product Review Sites
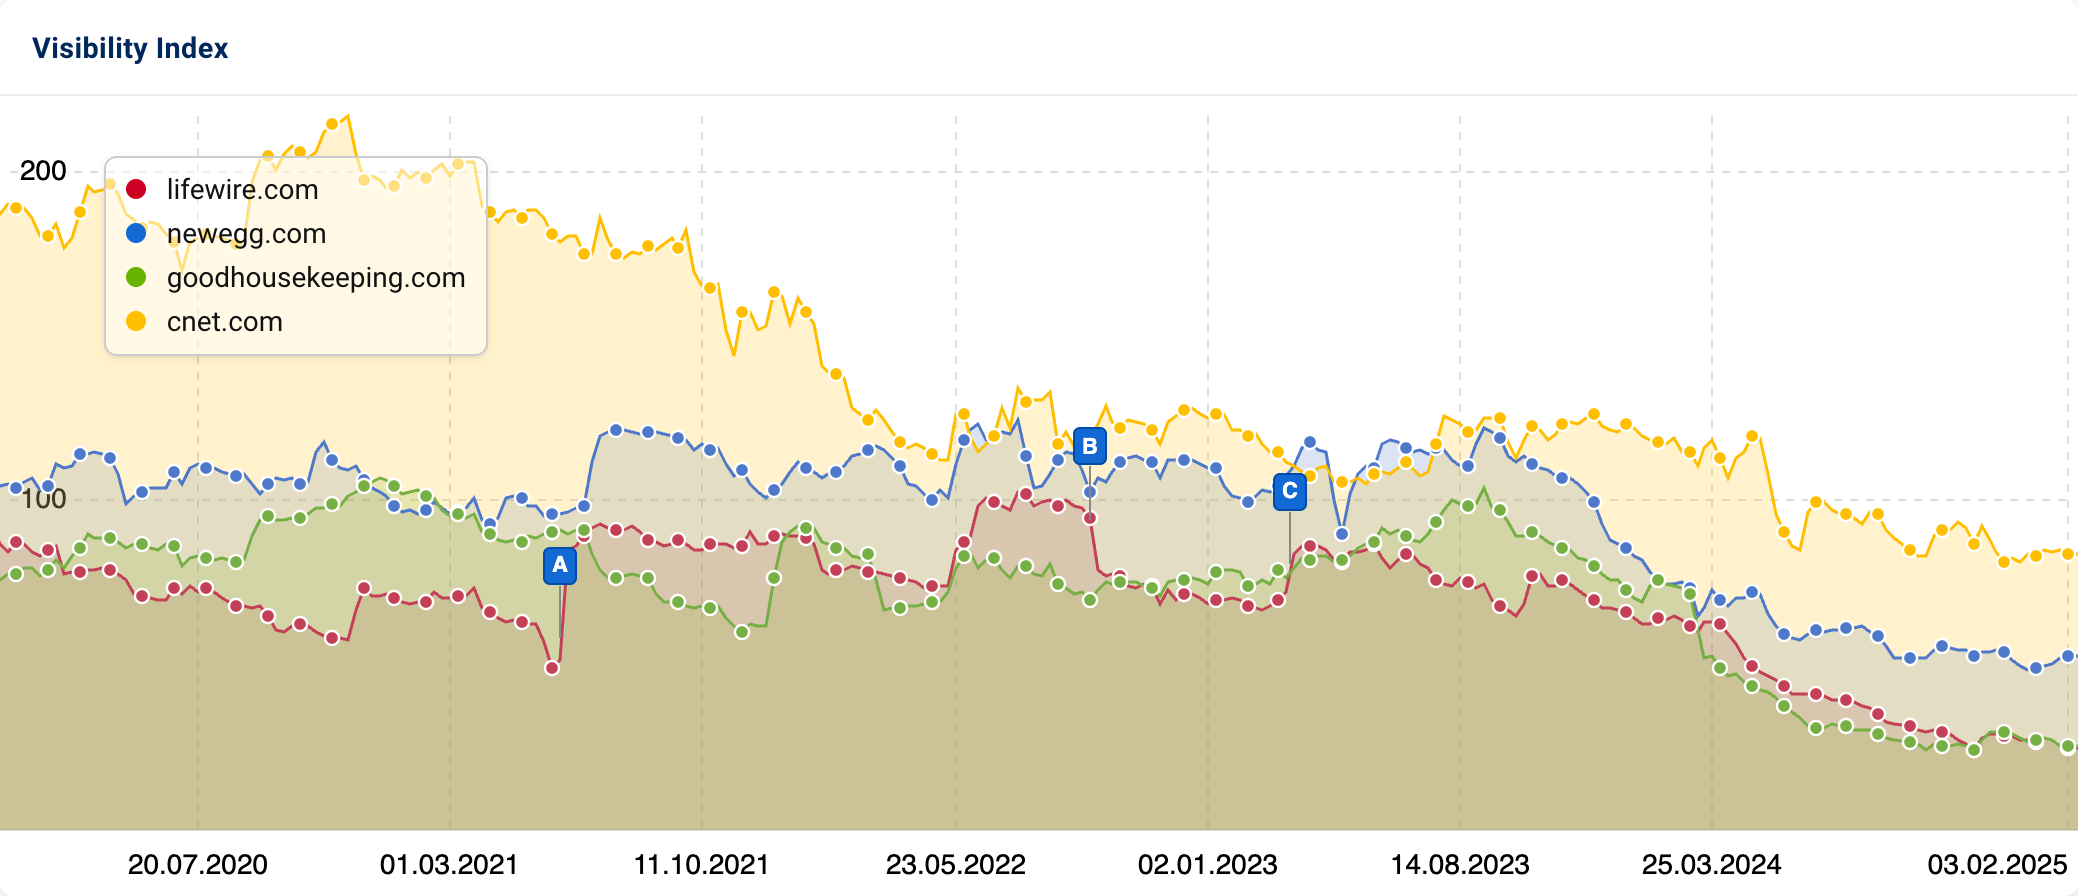
Several prominent websites focused on product reviews saw substantial visibility declines throughout the year, which appear to have been exacerbated by the March 2024 Core Update. The below chart shows how Lifewire.com, Newegg.com, Goodhousekeeping.com, and Cnet.com, all of which feature product reviews across many different categories, saw visibility declines throughout 2024. This trend was exacerbated by major drops occurring during the March 2024 Core Update (letter A), which extended through the beginning of May.
Programmatic SEO & Thin Affiliate Content
“Programmatic SEO” is the technique of using a database to automate the scaling of thousands of pages that closely match users’ search queries. These pages often contain publicly available data or information, such as Census Bureau data or reviews scraped from other sites.
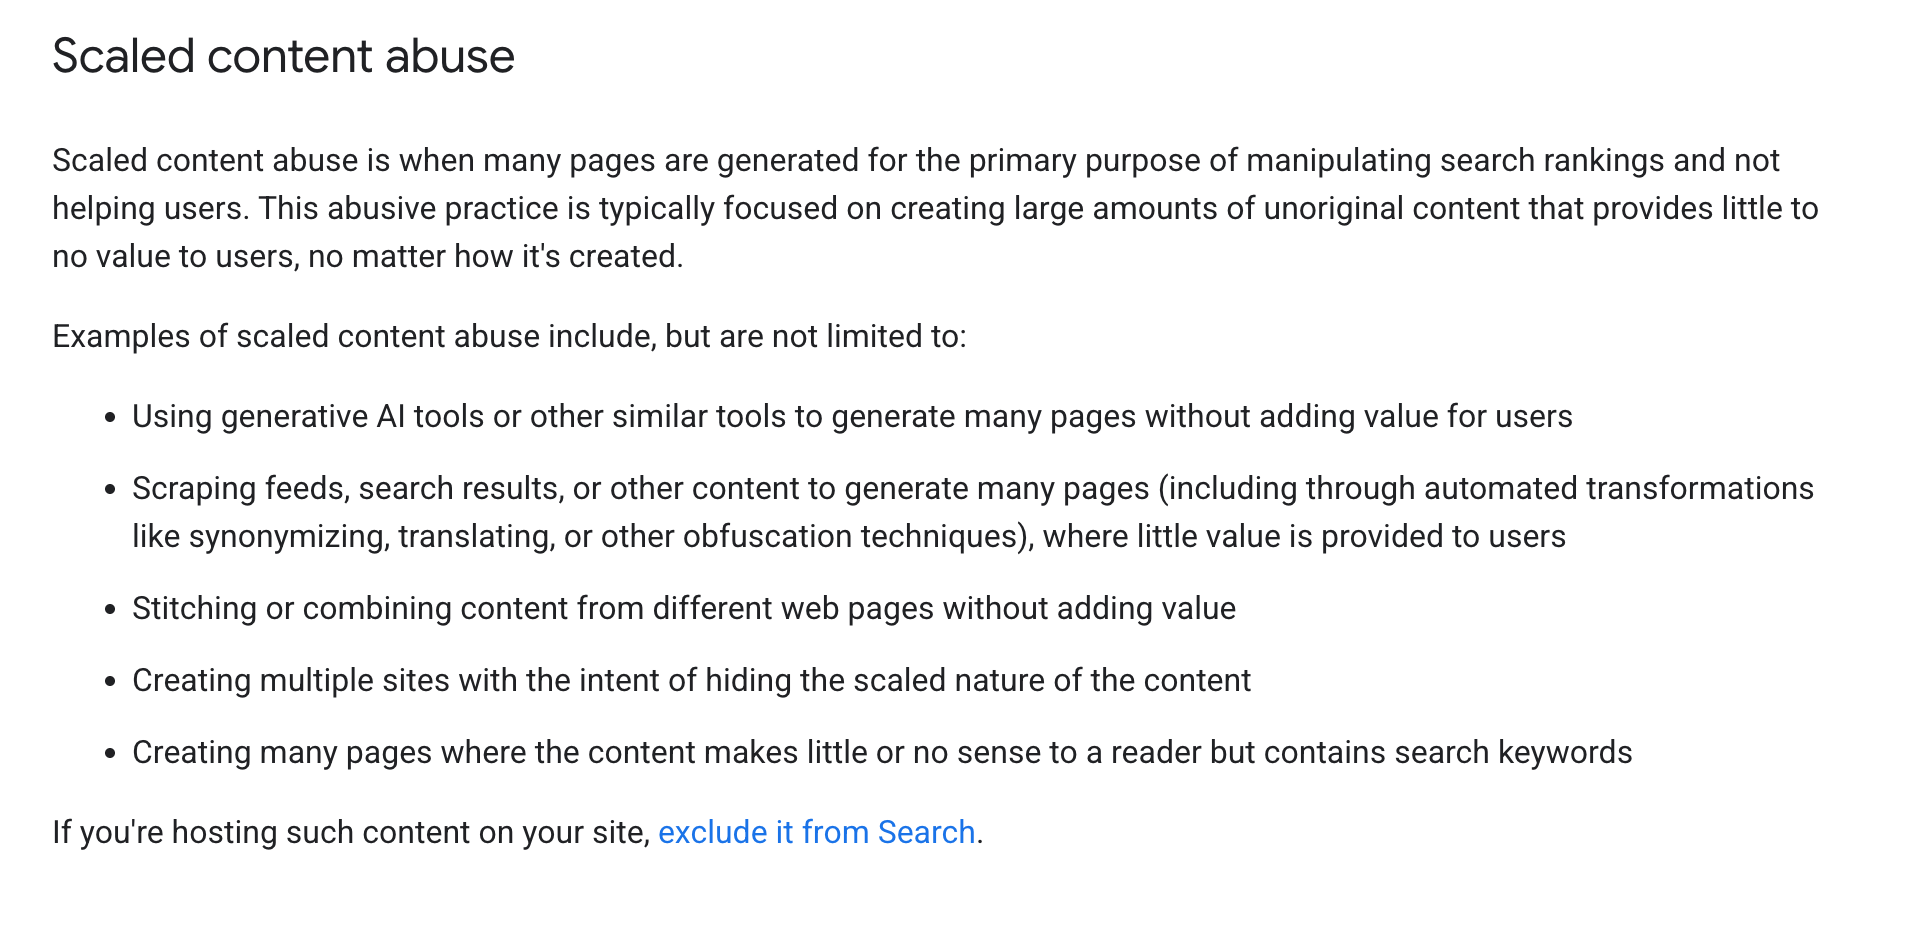
While this tactic can be implemented in ways that successfully drive organic traffic, it also comes with the risk of being treated as a form of “scaled content abuse.” According to Google, scaled content abuse can occur when sites “scrape feeds, search results, or other content to generate many pages (including through automated transformations)… where little value is provided to users.”
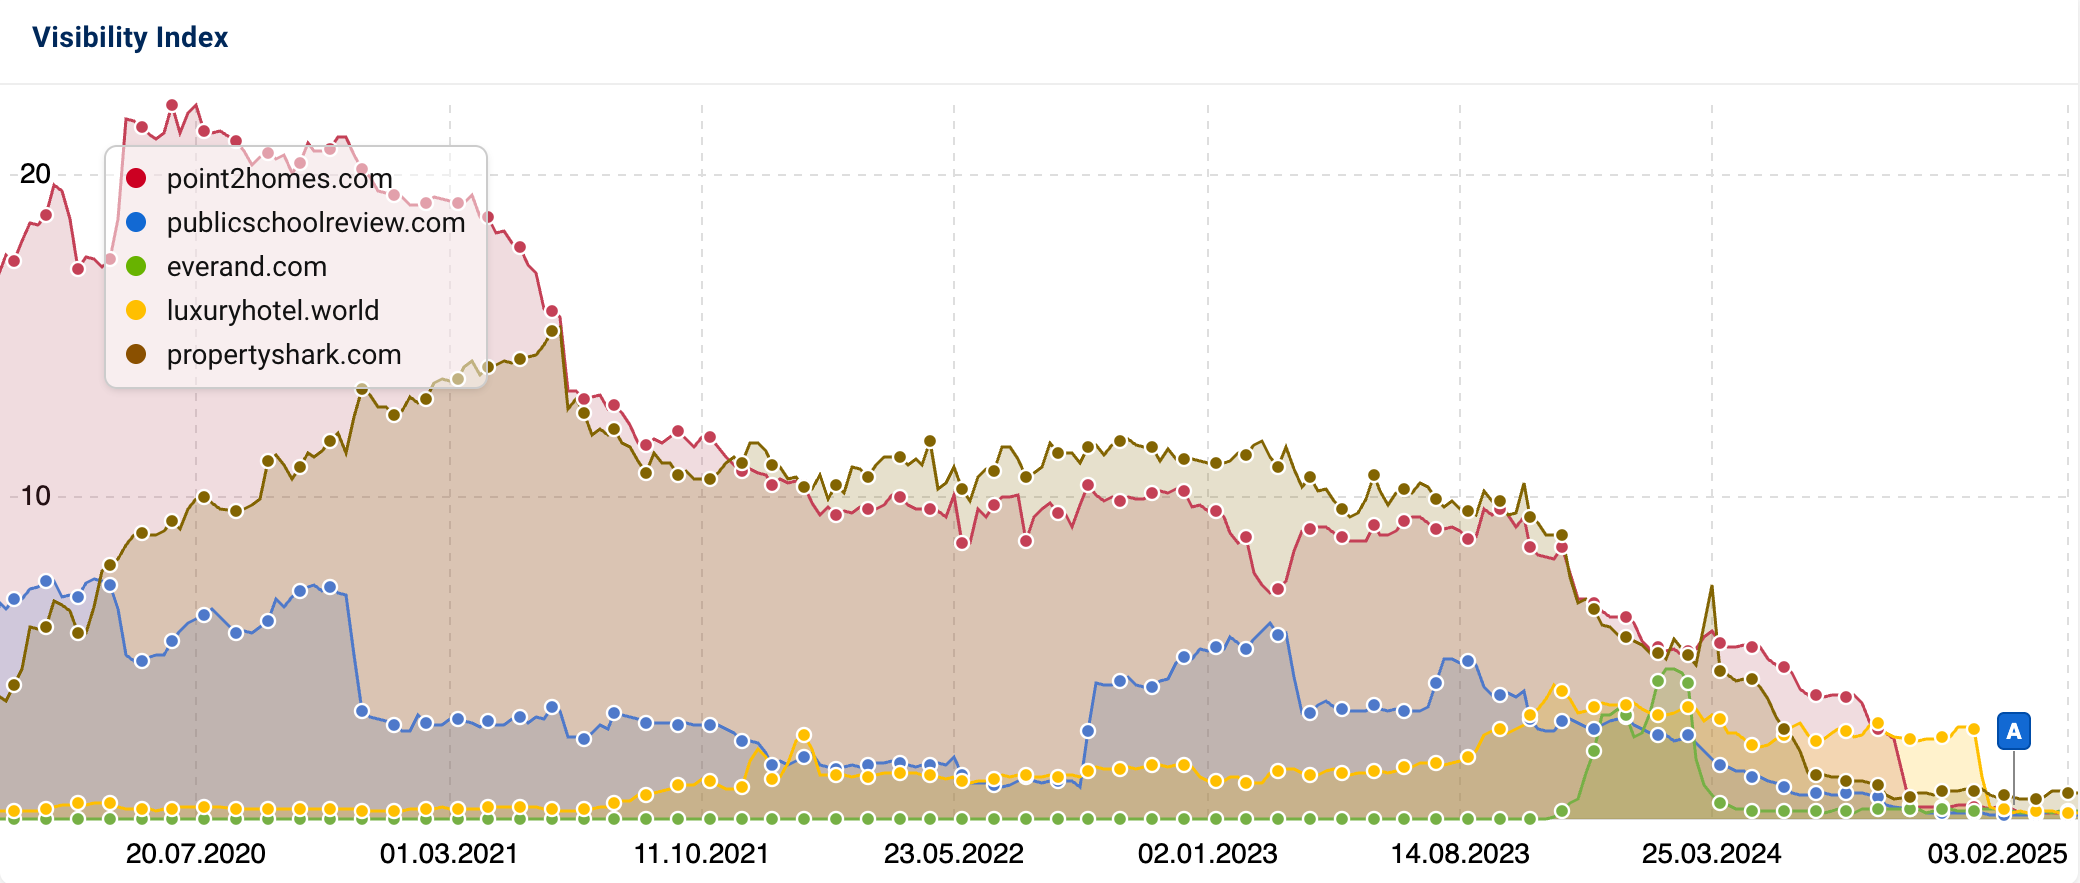
Many of the biggest losers appear to fall into this category. For example, the below sites contain thousands of keyword-targeted pages containing information collected or scraped from other sites, such as population and demographic information; luxury hotel listings (with affiliate links to major OTAs), or data about public schools.
Below is an example of how these pages look in Google’s search results. While the pages each technically contain unique content, the site claims to “[analyze and update] numerous public data sets from federal and state education agencies,” as its approach to content creation. This could fit Google’s criteria for scaled content abuse, if Google’s algorithms determine this content’s primary purpose is to manipulate search rankings and not help users. Of course, this is subjective, as many users are likely to find value in the way these sites present content. However, Google is able to make its own decisions about what content it believes is written primarily for search engines and not meant for users first.

Content-Focused Publications
Many niche sites, whose primary purpose is to provide informational or comparison content related to highly searched topics, each saw dramatic percent visibility declines greater than -80%. These sites offer a steady stream of informational content on various topics, such as ‘how to’ articles or instructional guides, and often implement aggressive display advertising tactics and/or affiliate links as their primary source of monetization.
Below are several examples:
| Domain | Absolute Change | Percent Change | 01.01.2024 | 30.12.2024 |
|---|---|---|---|---|
| autoblog.com | -9.07 | -92.30% | 9.8238 | 0.7574 |
| stylecraze.com | -3.06 | -91.20% | 3.352 | 0.2941 |
| thewindowsclub.com | -3.21 | -91.00% | 3.5285 | 0.3161 |
| womansday.com | -9.54 | -87.50% | 10.903 | 1.3671 |
| expertphotography.com | -2.81 | -87.40% | 3.2198 | 0.406 |
| wallstreetmojo.com | -2.72 | -84.90% | 3.2026 | 0.482 |
| allthatsinteresting.com | -3.16 | -84.40% | 3.7444 | 0.5847 |
| sarahmaker.com | -2.99 | -84.40% | 3.5463 | 0.5542 |
| hostingadvice.com | -3.05 | -84.30% | 3.6168 | 0.5687 |
| womansday.com | -9.54 | -87.50% | 10.903 | 1.3671 |
| a-z-animals.com | -9.26 | -82.40% | 11.2303 | 1.9743 |
For most of these sites, the most precipitous drops took place during the March Core and Spam Updates, where Google claims to have reduced the visibility of “unhelpful” content in the search results by 45%:
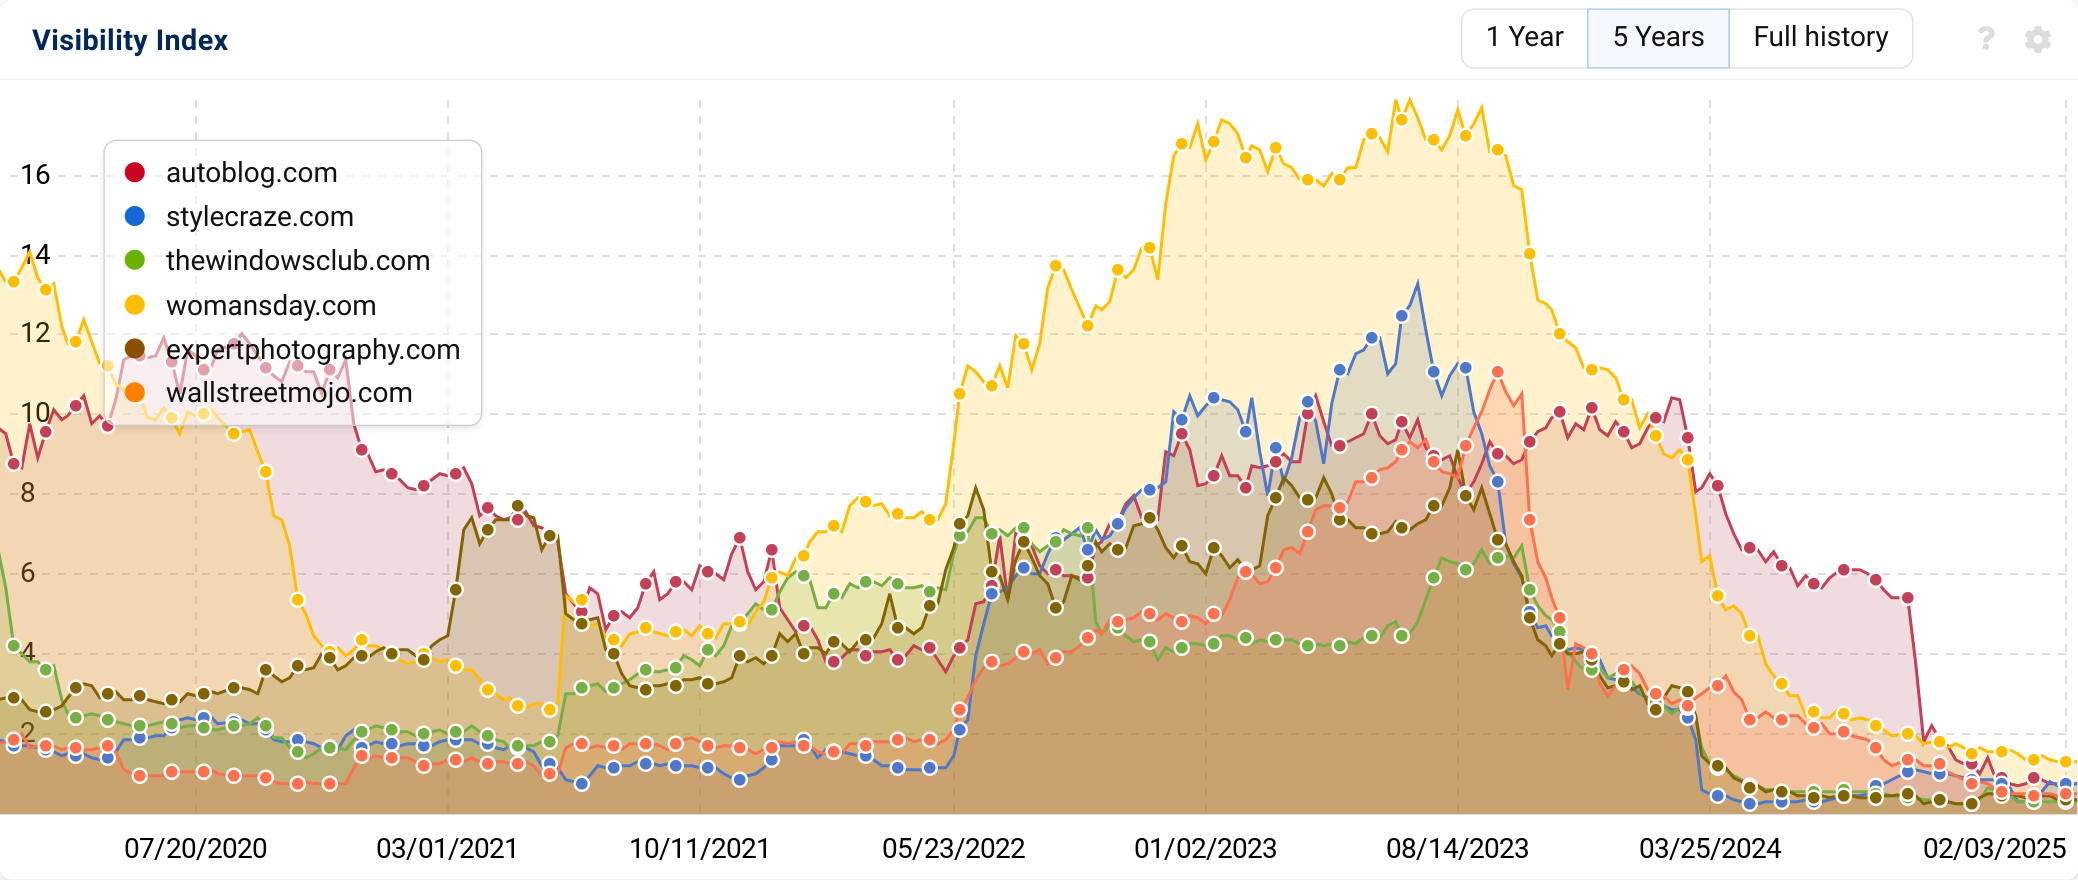
Throughout 2024, Google appeared to reduce the overall visibility of niche informational sites in favor of ranking user-generated content on forums, ecommerce results, and/or product and service pages from major brand websites.
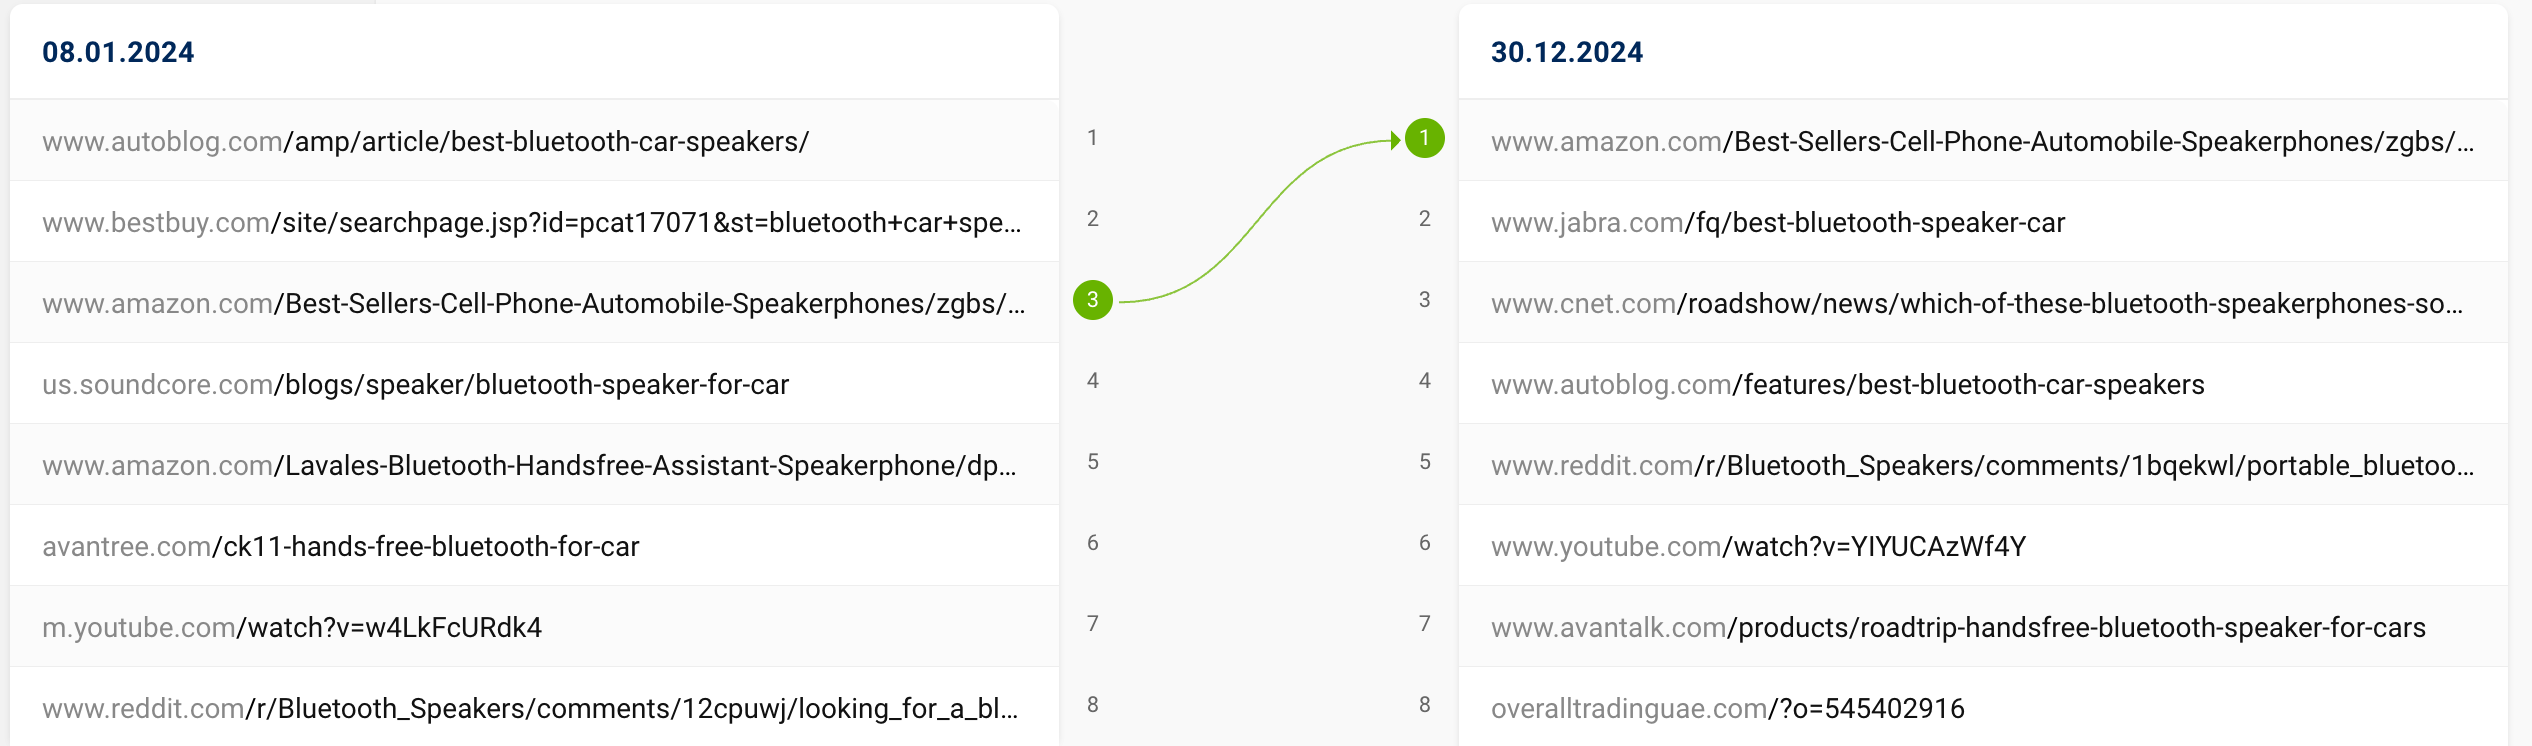
For example, the below SERP comparison shows how the site autoblog.com held the position 1 ranking at the beginning of 2024 for “best bluetooth car speakerphone,” a 750 MSV keyword. By the end of 2024, several shifts had taken place in the SERP, which were common throughout 2024:
- Autoblog moved from position 1 to position 4
- Amazon and Jabra (ecommerce sites) moved into the top 2 positions
- CNET began ranking in the top 10
- Reddit earned an extra ranking result and stronger rankings, plus a new top 10 result for Quora
- YouTube improved in rankings
Ecommerce
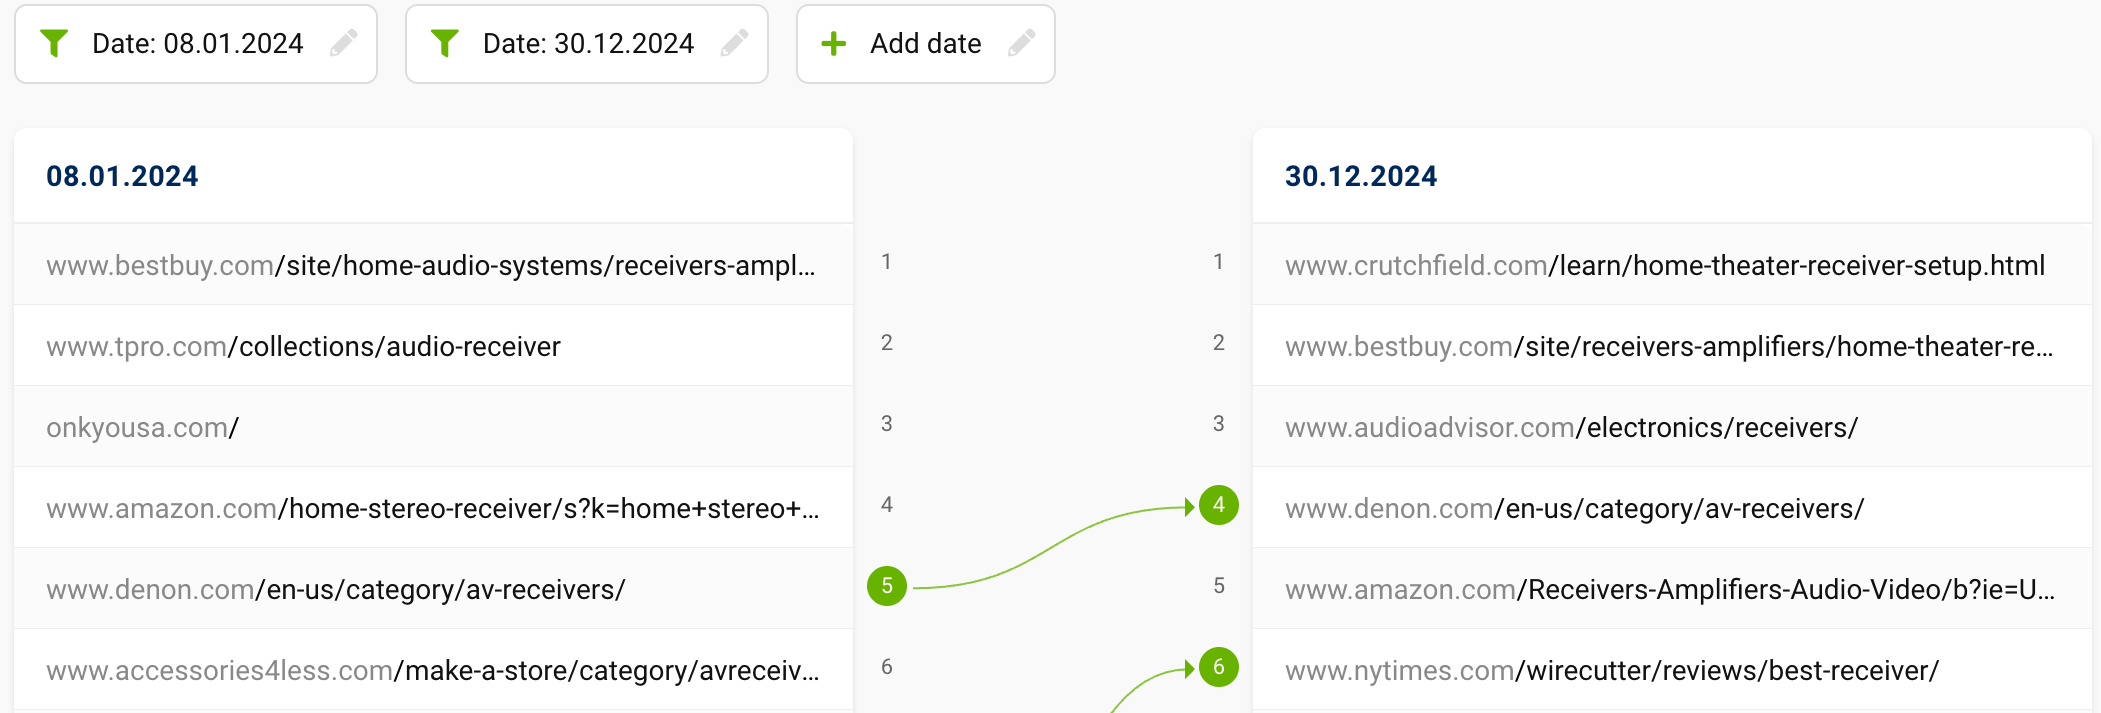
Several large ecommerce players, such as Bestbuy.com, Walmart.com, Homedepot.com, Etsy.com, and Macys.com, saw gradual declines throughout 2024.
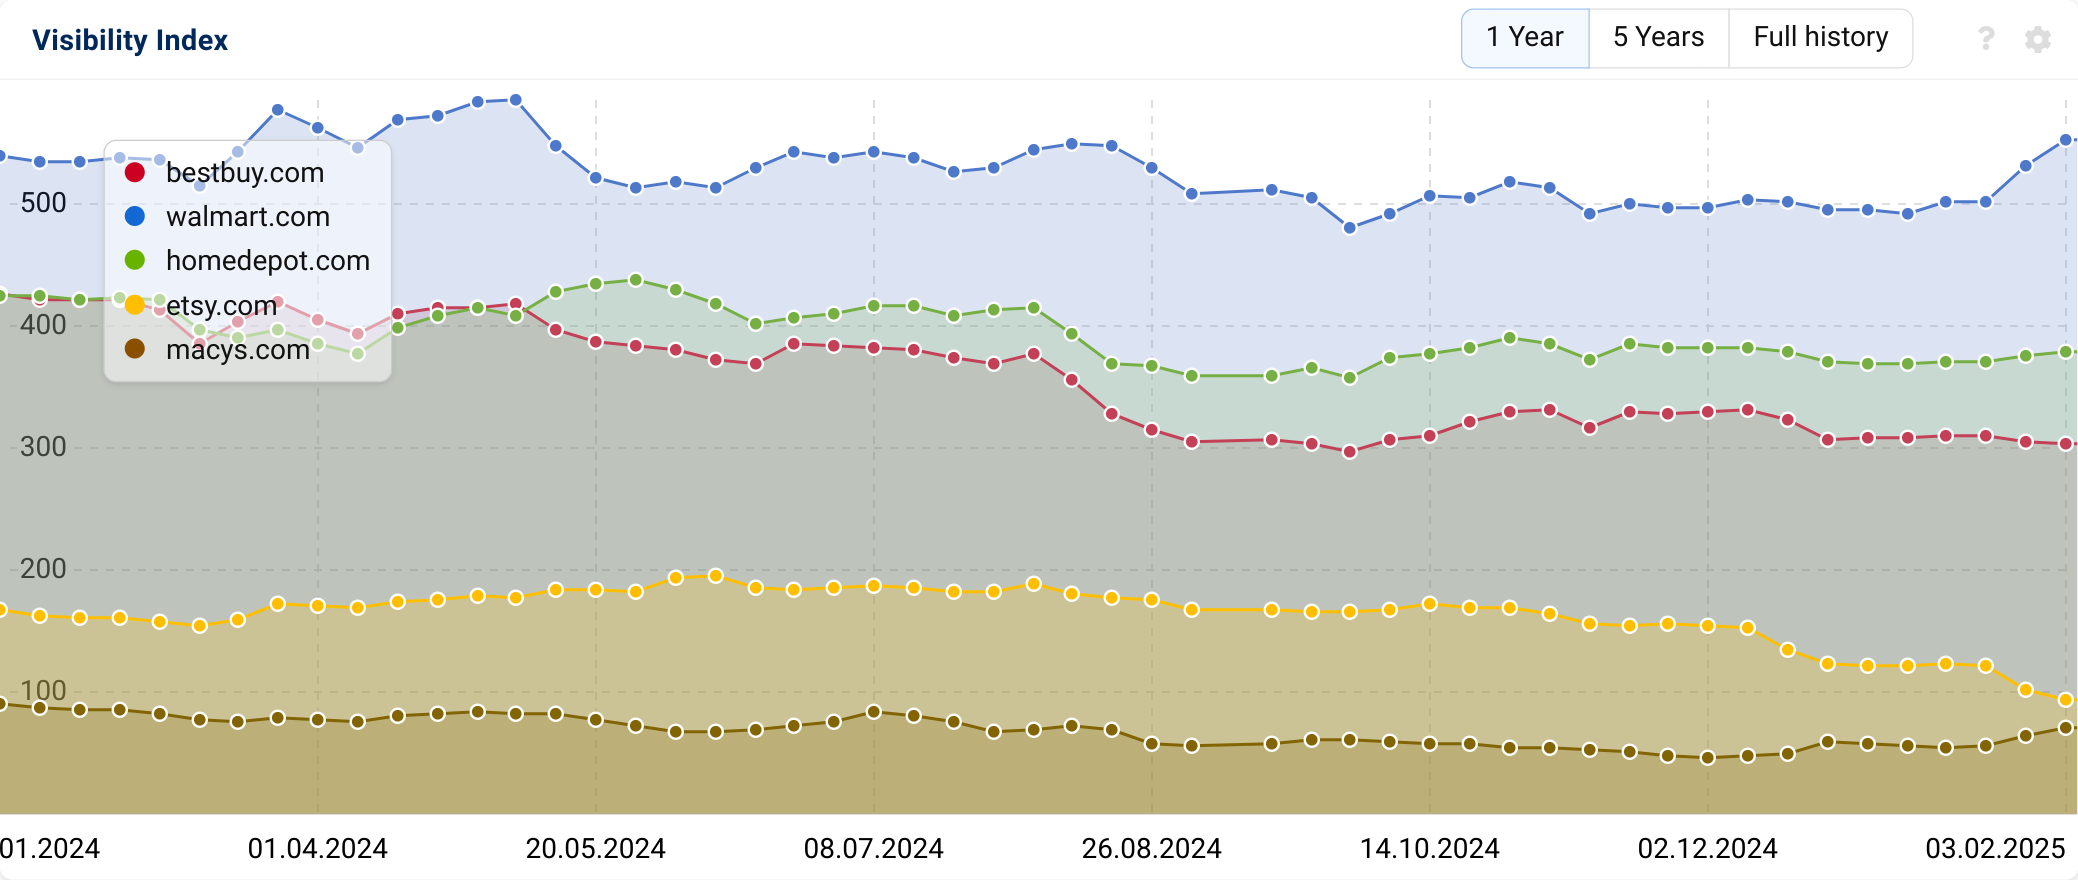
While the overall absolute visibility declines were significant for each of these sites throughout 2024, drilling down into individual keyword drops does not reveal any obvious patterns or examples of major ranking declines. Instead, the sites appear to have lost a few positions each for a wide variety of commercial keywords, which has a significant impact in aggregate.

In many cases, the sites appear to have lost top rankings to more niche ecommerce competitors whose brand specializes in that product. For example, BestBuy.com lost the #1 ranking for the keyword “speaker receiver” to the website Crutchfield, which, according to the brand website, is a “car and home audio/video electronics retailer.”
Travel Blogs & Online Travel Agencies
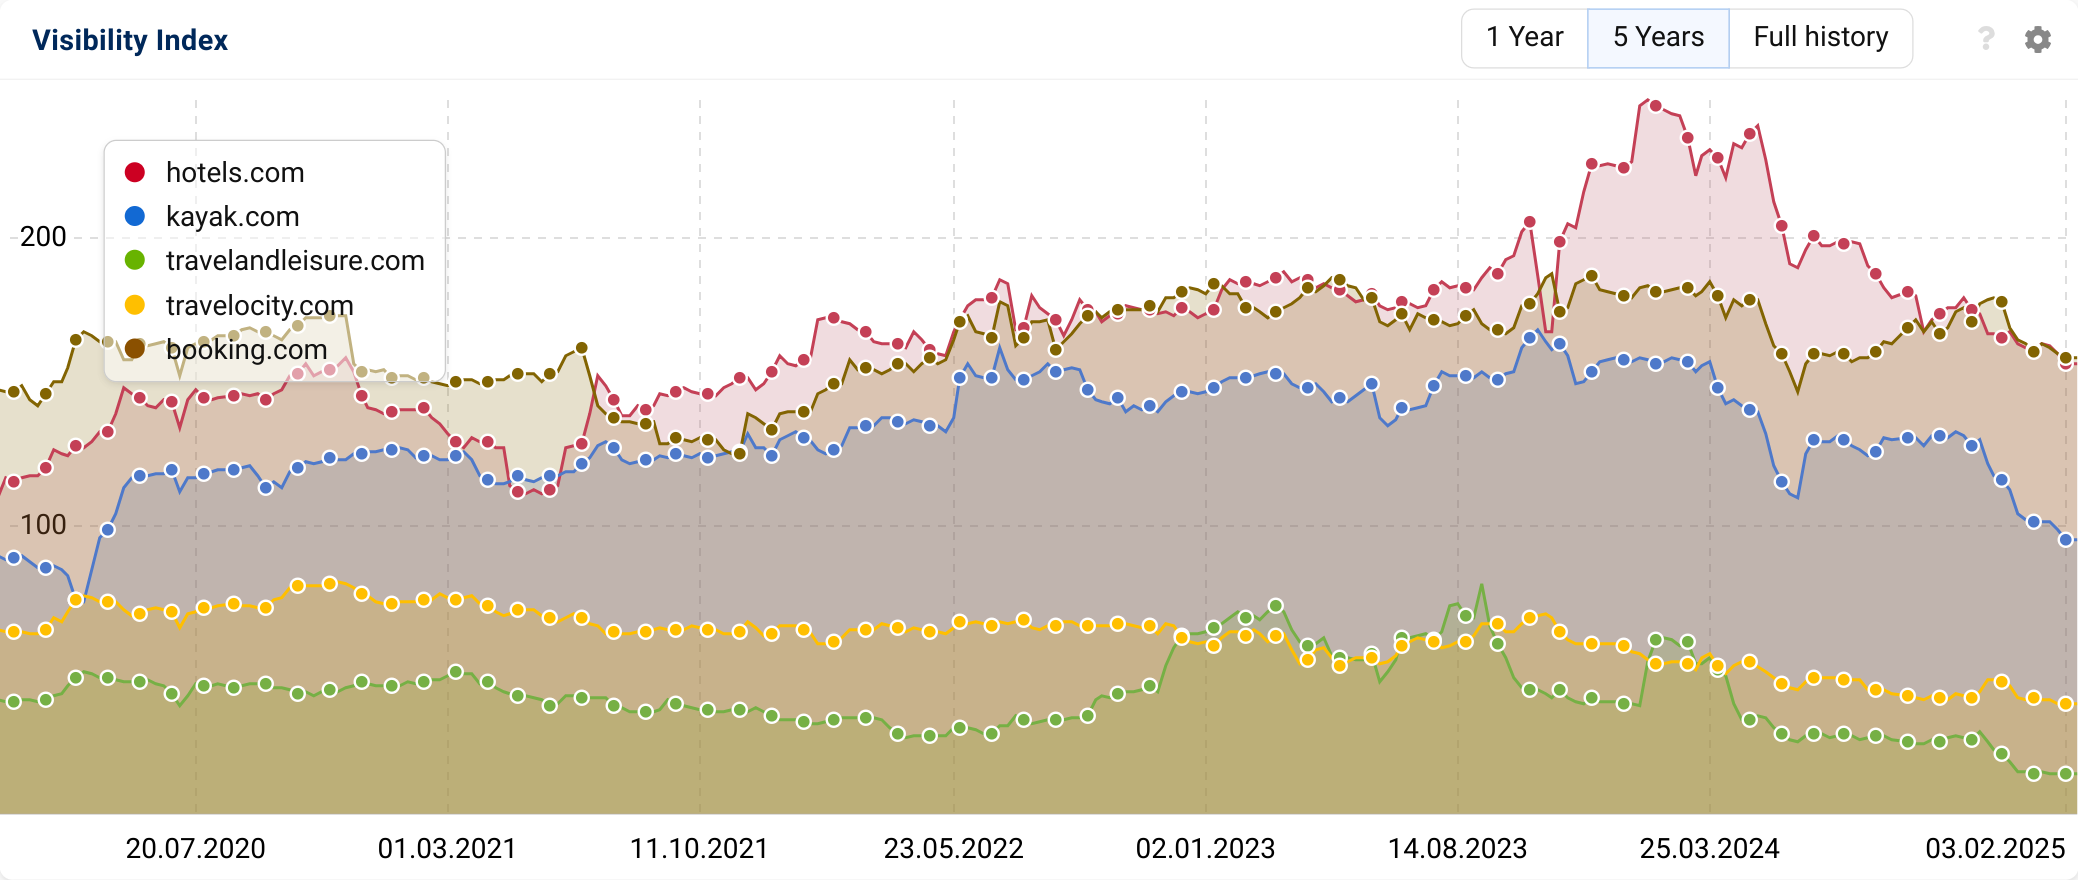
Various travel websites appeared in the list of greatest visibility losers, including big players like Hotels.com, Kayak.com, and TravelandLeisure.com:
| Domain | Absolute Change | Percent Change | 01.01.2024 | 30.12.2024 |
|---|---|---|---|---|
| hotels.com | -62.76 | -28.00% | 224.5329 | 161.7699 |
| kayak.com | -56.11 | -35.50% | 158.1557 | 102.0476 |
| travelandleisure.com | -23.92 | -61.90% | 38.631 | 14.713 |
| travelocity.com | -19.01 | -32.30% | 58.8015 | 39.7916 |
| booking.com | -17.18 | -9.50% | 180.0415 | 162.8639 |
| lonelyplanet.com | -16.76 | -38.50% | 43.5749 | 26.8127 |
| cntraveler.com | -16.21 | -44.70% | 36.2329 | 20.0256 |
| theculturetrip.com | -3.86 | -84.90% | 4.5411 | 0.6858 |
| planetware.com | -3.15 | -89.00% | 3.5361 | 0.389 |
Several of these sites saw similar visibility patterns, with big gains at the start of 2024, and gradual declines beginning in May. Interestingly, a few of the sites saw visibility drops followed by increases between May 6 and June 10, which could indicate that the movement was algorithmic and affected various sites within the travel category.
Looking at patterns across keyword declines, one trend is clear: these OTA sites are now competing more heavily with official airline websites, hotel websites, and Google’s own travel website, Google Travel.

For the keyword “flights to New York” in the above example, Kayak dropped from position 3 in February to position 6 in December. Google Travel earned the #3 ranking during this timeframe, after not having ranked anywhere in the top 10.
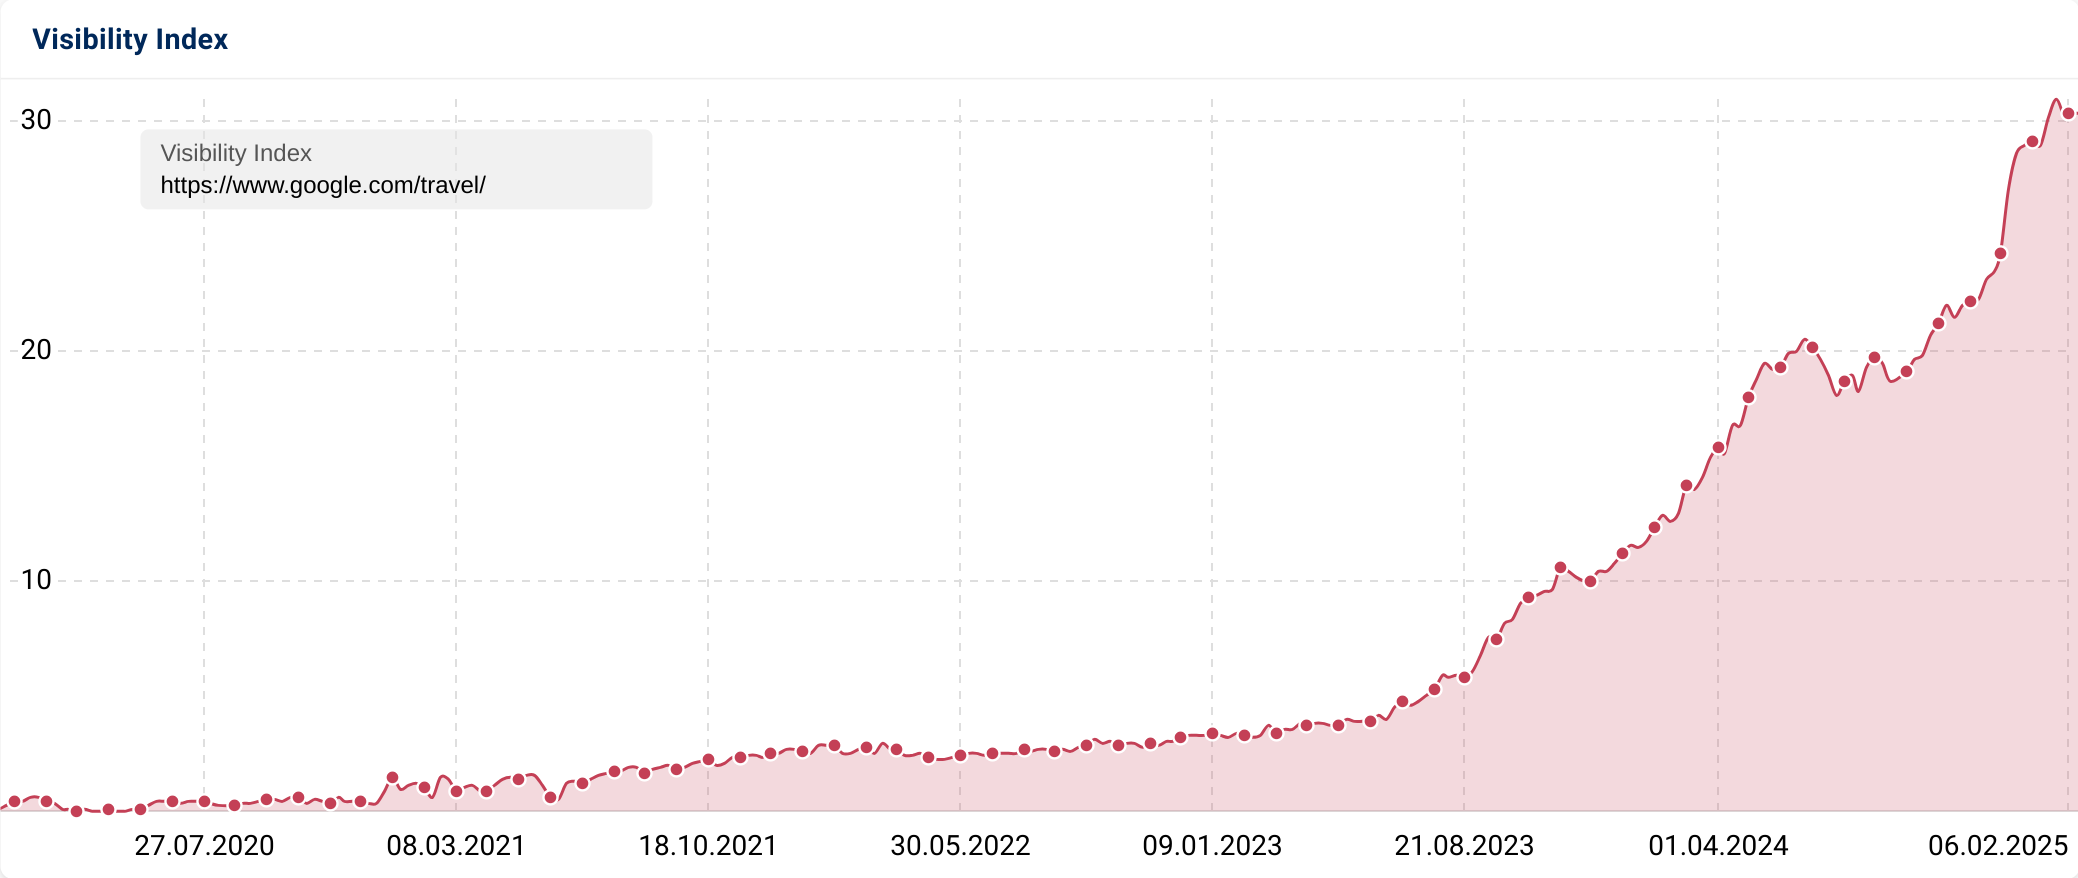
As you can see in the above chart, Google Travel (google.com/travel) has exploded in SEO visibility in the last 2 years, becoming a new competitor to many of the major OTA websites.
Conclusion
2024 marked a significant shift in Google’s search landscape, with many previously successful websites experiencing dramatic declines in visibility. The March Core and Spam Updates proved to be particularly impactful, with Google claiming to remove approximately 45% of what it deemed “unhelpful” content from search results. These changes appear to have disproportionately affected product review sites, content-focused publications, certain programmatic SEO implementations, and some travel and ecommerce platforms. The introduction of new spam policies targeting site reputation abuse, scaled content abuse, and expired domain abuse caused further declines throughout the year,
A clear trend emerged throughout the year as Google shifted away from traditional review and informational articles from publisher sites in favor of user-generated content from platforms like Reddit and Quora. Major publishers like Forbes saw significant drops in visibility across specific content categories due to both algorithmic changes and manual actions, while ecommerce giants like Best Buy and Walmart experienced gradual declines across a broad spectrum of commercial keywords. These changes reflect Google’s continued emphasis on prioritizing content that provides genuine value to users over content primarily optimized for search engines, which was consistently shared throughout Google’s communications in 2024.
All IndexWatch 2024 reports
Winners 2024
- 🇪🇸 Spain (by Arturo Marimón)
- 🇫🇷 France (by Nicolas Audemar)
- 🇮🇹 Italy (by Elisa Paesante)
- 🇩🇪 Germany (Jolle Lahr-Eigen)
- 🇬🇧 UK (Luce Rawlings)
- 🇺🇲 US (Lily Ray)
Losers 2024
- 🇪🇸 Spain (by Arturo Marimón)
- 🇫🇷 France (by Nicolas Audemar)
- 🇮🇹 Italy (by Elisa Paesante)
- 🇩🇪 Germany (Jolle Lahr-Eigen)
- 🇬🇧 UK (Luce Rawlings)
- 🇺🇲 US (Lily Ray)
You can assess live data from all domains and grow your visibility with the Free SISTRIX Trial.