We’ve reflected on the winners of the year, but what about those domains that struggled in 2022? Using our Visibility Index archives, we have uncovered 200 sites that have seen significant declines in visibility on UK Google. Read on for lists and expert analysis.
Visibility nosedive for Vox
Vox.com experienced one of the most significant visibility losses in 2022 (-72.52%). Vox publishes US news and opinion-oriented content.
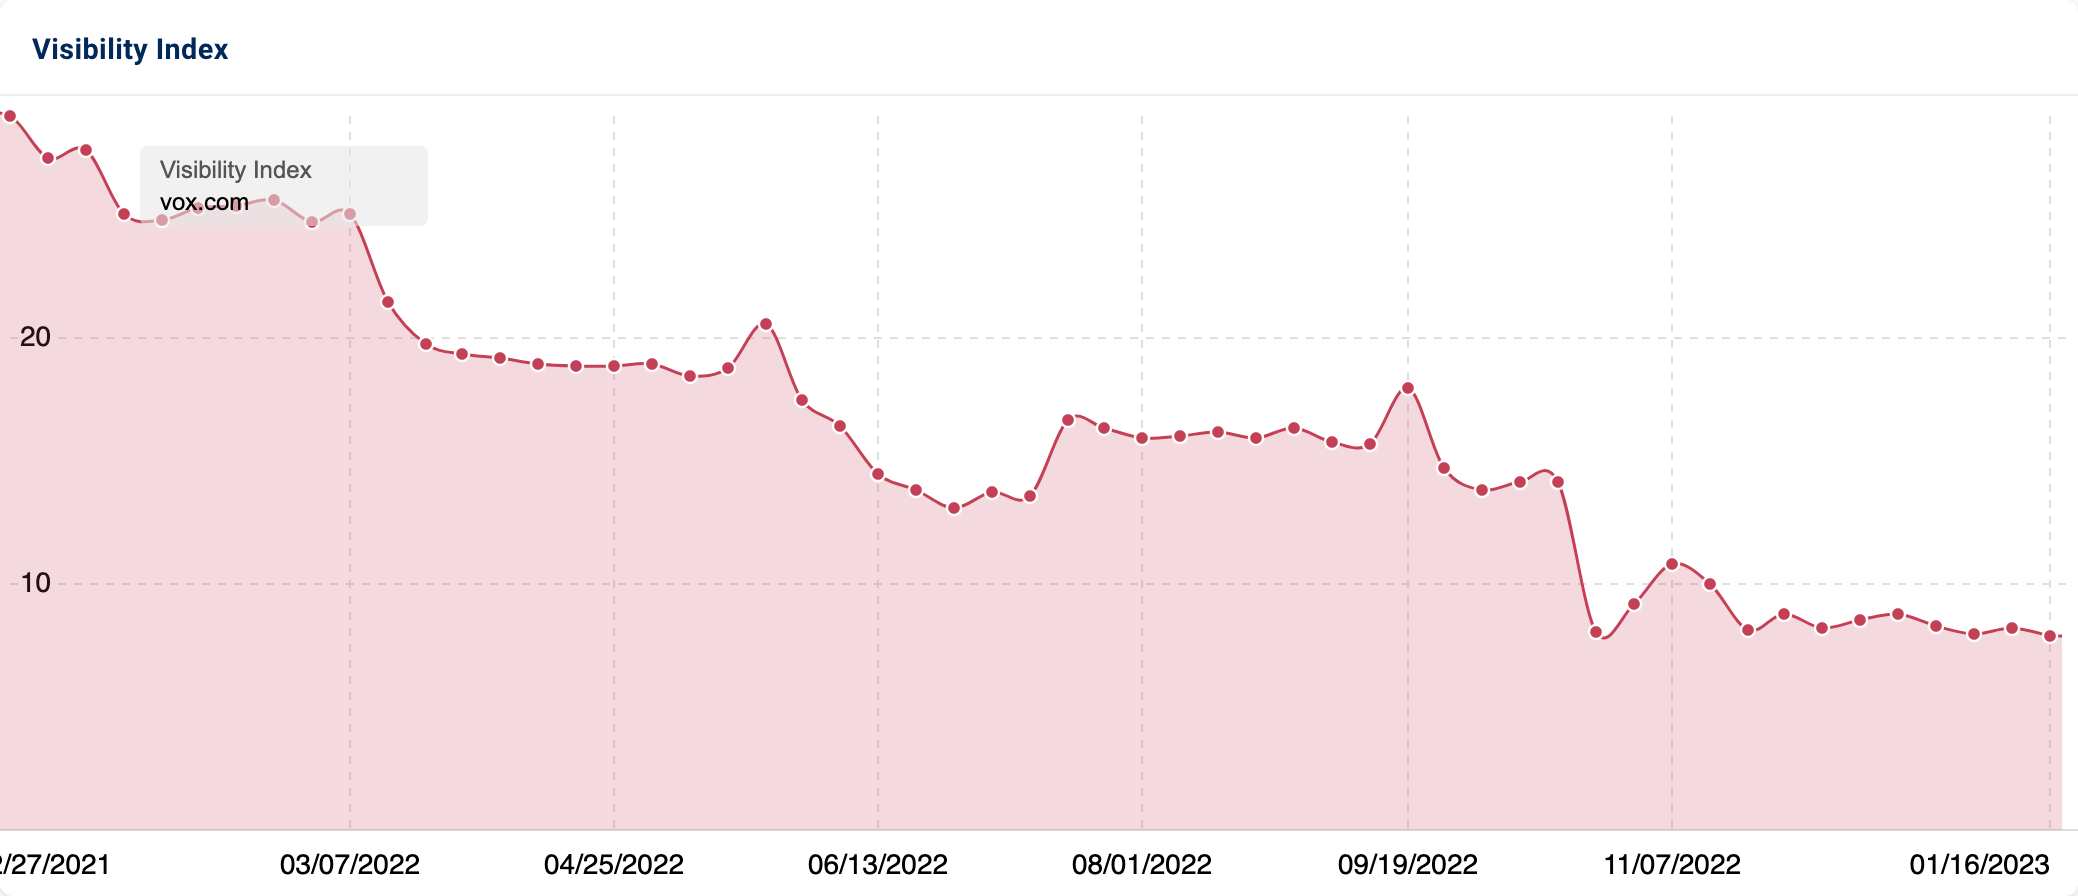
Since the end of 2021, the organic visibility of vox.com on UK Google has seen an ongoing decrease. The “/platform” subfolder has seen the most significant drop-off over the last 12 months. It has lost rankings for 322,084 keywords and seen ranking decreases for 193,063.
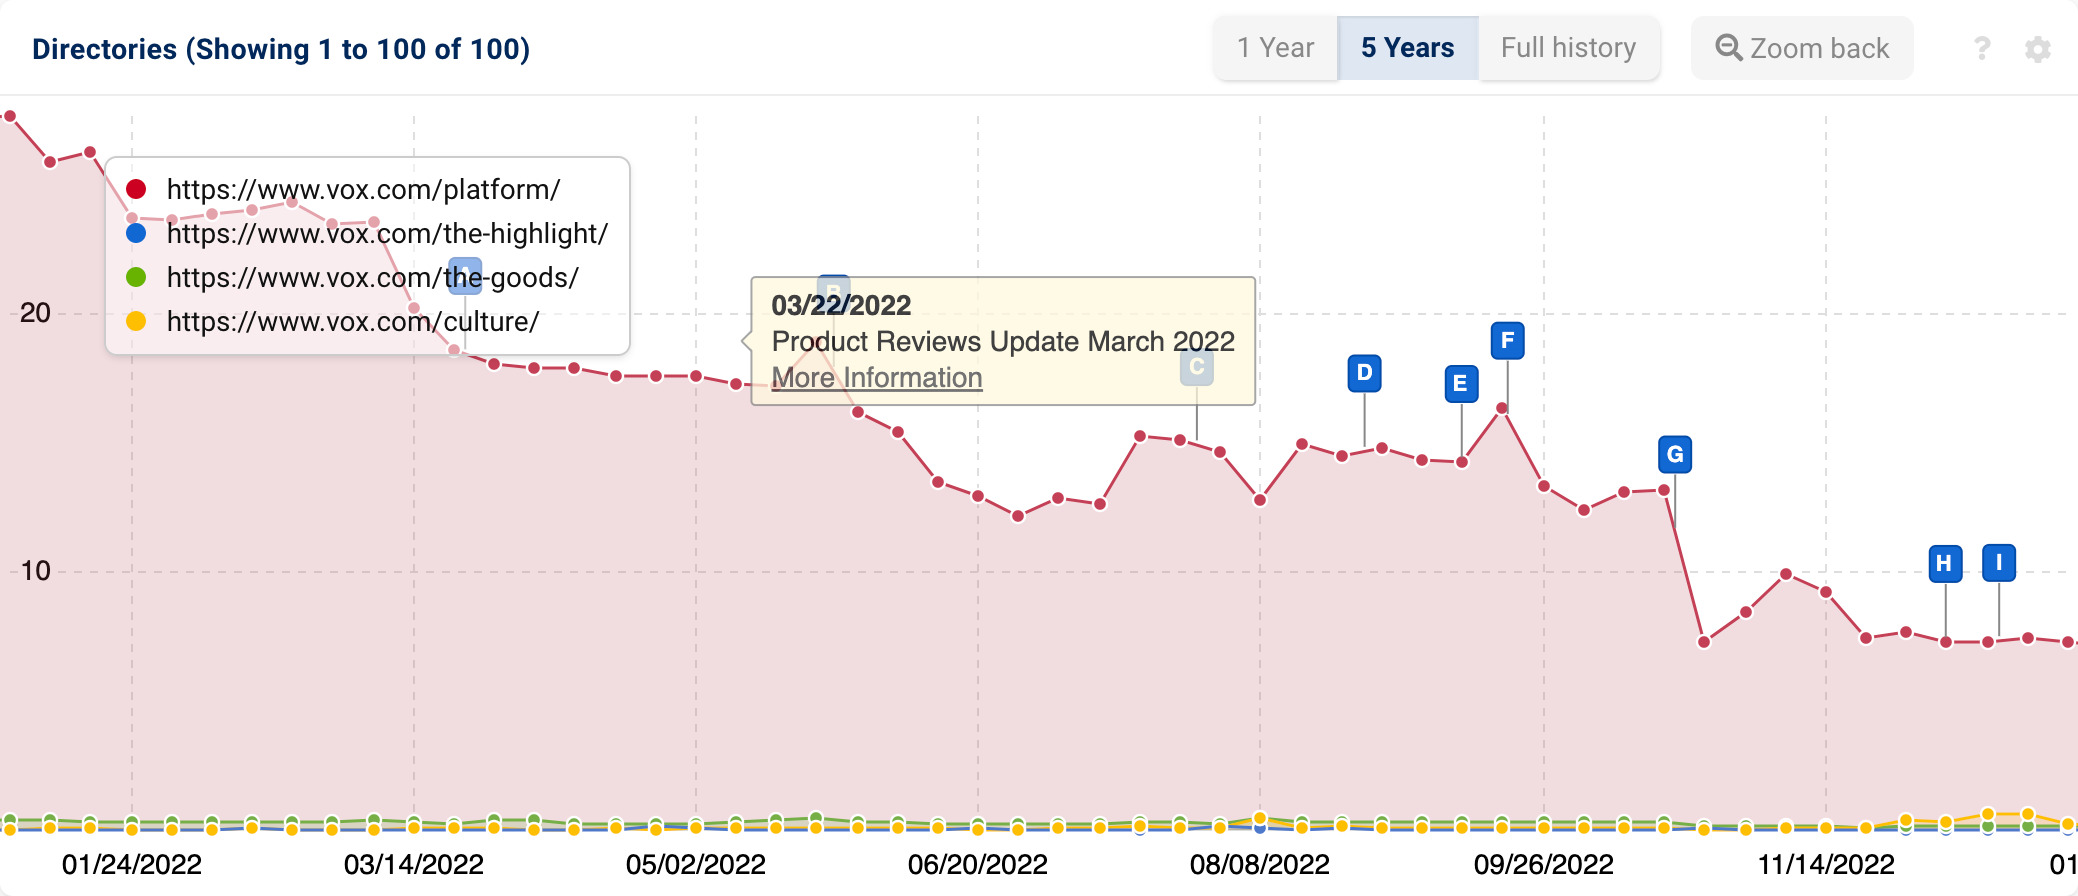
The March Product Review Update was the first update of 2022 to impact visibility. Throughout the year, there have been glimmers of improvement. But, on the whole, performance has continued on a downward trajectory. Notable dips occurred following the May Core, September Product Review & October Spam Updates.
The “/platform” subfolder houses AMP versions of articles. Unlike other websites that have moved away from AMP, Vox is still embracing it. Yet, when comparing URL data on 3rd January 2022 to 2nd January 2023, 759 AMP pages have lost ranking. This is the result of Google abiding by the canonical tags to non-AMP versions (canonicalising AMP to non-AMP is SEO best practice).
Despite the use of canonical tags to non-AMP pages, it is desirable for AMP versions to be served to mobile users. Interestingly, in the case of vox.com, the mobile SERPs are not always serving content in AMP format.
Inspecting the page source confirms that the necessary “amphtml” code is present. AMP not being served suggests that pages may not meet other requirements within Google’s AMP HTML Specification. Aside from this and schema, the spec refers to minified scripts and user experience, amongst other elements.
The domain also covers many Your Money Your Life (YMYL) topics relevant to Americans. This is likely to be a factor in its visibility demise.
For maximum contextual relevance, UK users should be served news from UK sources. This is particularly important for YMYL content as what may apply to US users may not be for UK ones.
Additionally, Vox does contain a lot of sponsored content. This includes intrusive banner ads (top and sides of pages) and paid article placements. The quantity and location may be impacted UX and consequently, SERP visibility.

Notable drop-offs for news and entertainment publications
In parallel with vox.com, many other online news and entertainment outlets have seen a decline in their SERP presence.
The Guardian
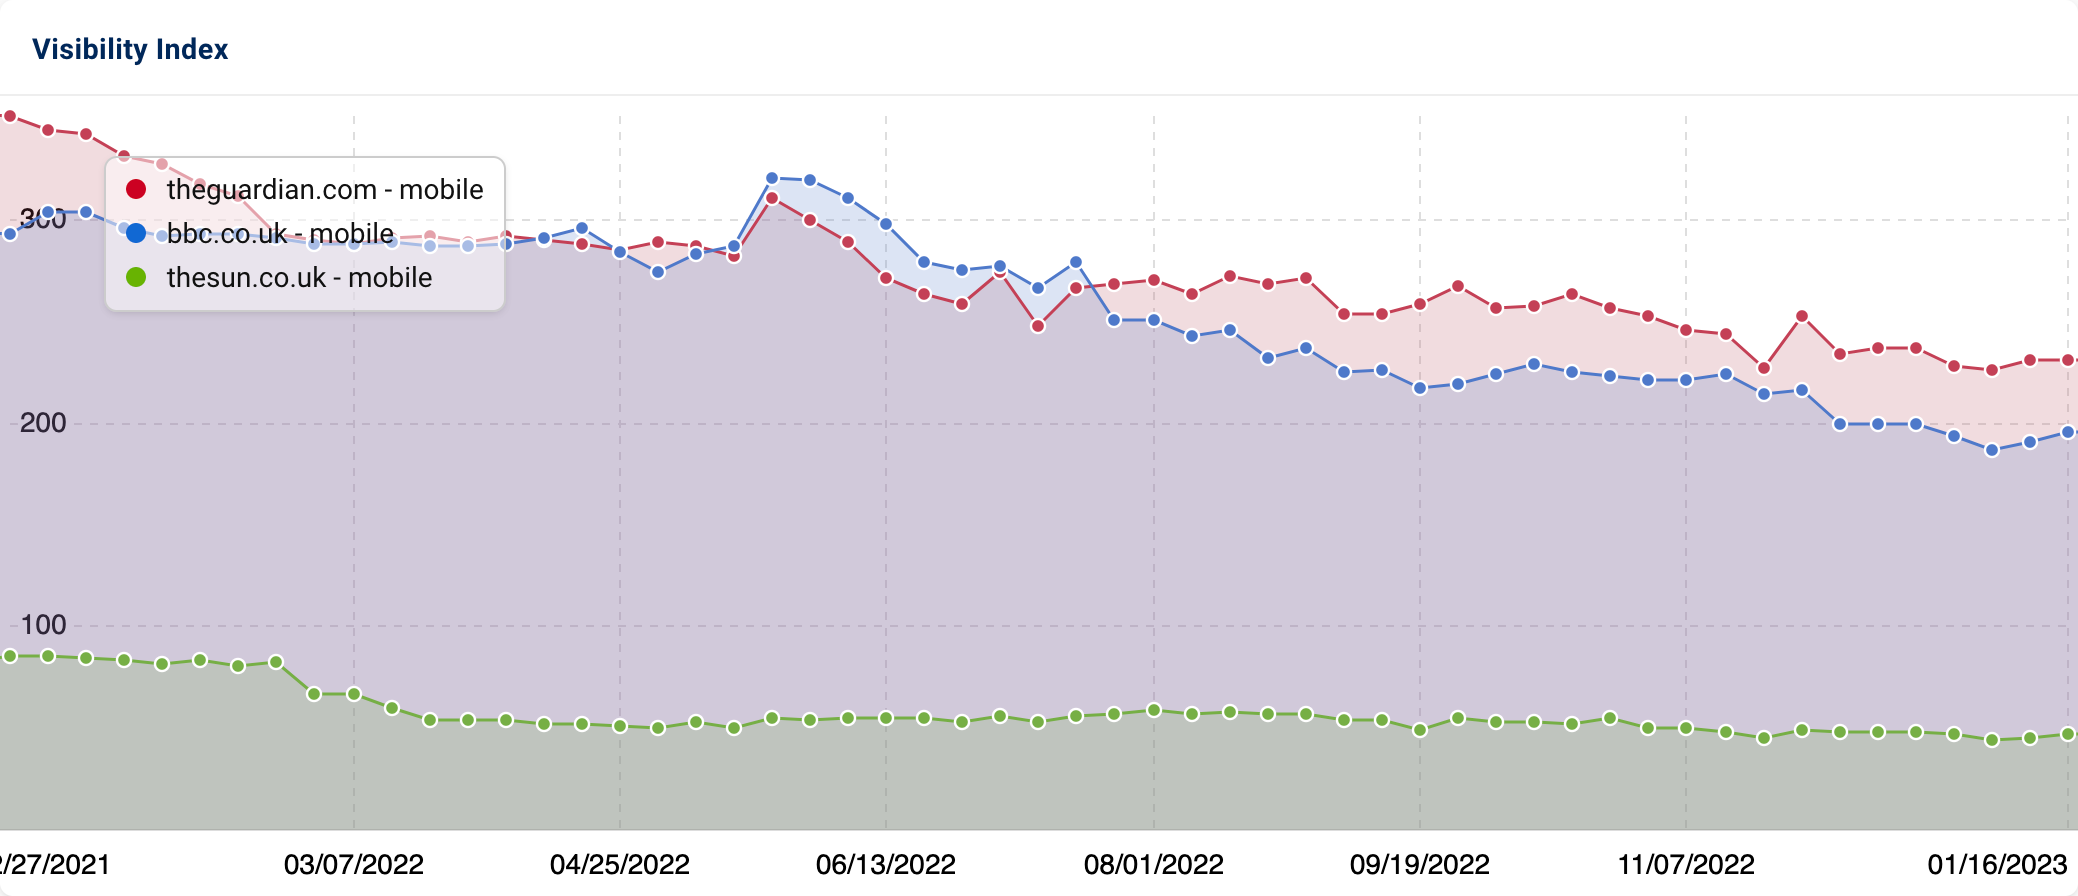
Within their sector, theguardian.com saw the greatest visibility decline (-125.3 VI points). Over the last 12 months, bbc.co.uk (-106.4 points) and thesun.co.uk (-40.7 points) also lost out on precious SERP real estate.
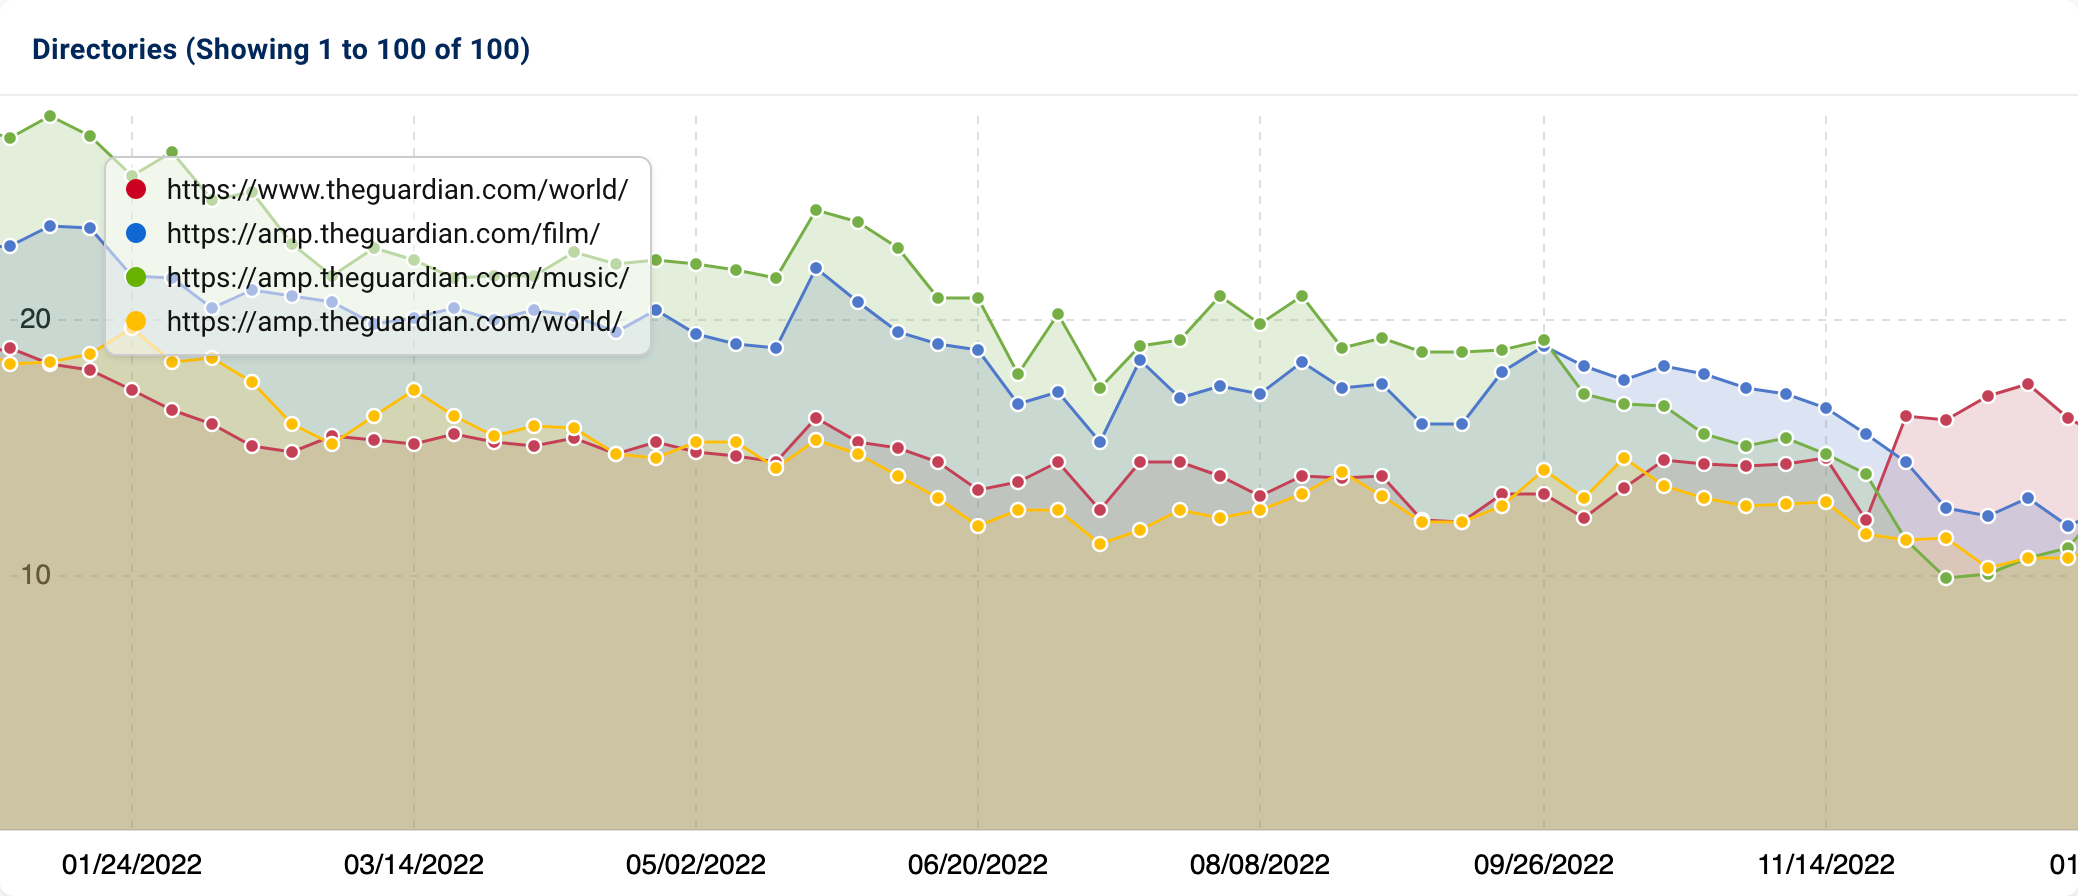
In the same vein as vox.com, AMP pages have largely contributed to the decrease in The Guardian’s UK Google visibility. AMP versions of the “/film”, “/music” and “/world” sections experienced the most prominent declines.
Although these sections saw an uptick in November/December, their visibility did not restore to the previous levels. The non-AMP version of the “/world” section also saw a gradual decline in performance over the 12-month period.
From 3rd January 2022 to 2nd January 2023, there were many ranking shifts from AMP to non-AMP content. The new rankings were a mix of like-for-like content and pages covering similar topics. In these cases, Google deemed the non-AMP equivalents as providing a less relevant result. Consequently, the keyword rankings were reallocated to new URLs.
Whilst ranking fluctuations of this nature are not unusual, this may suggest technical problems with the AMP pages. Like vox.com, the necessary “amphtml” markup is present. Perhaps the page is missing the mark in other respects, such as code efficiency or design.
Or perhaps the classic news URLs don’t belong in organic search results? From a list of 48 news media domains checked, nearly all lost visibility in 2022(!). Here’s a list of the top 20 losing domains, by absolute VI, of the year.
| Domain | 03.01.2022 | 02.01.2023 | Change VI | Change % |
|---|---|---|---|---|
| theguardian.com | 351.1 | 226.0 | -125.1 | -35.6% |
| thesun.co.uk | 85.4 | 44.6 | -40.8 | -47.7% |
| nytimes.com | 100.7 | 66.1 | -34.5 | -34.3% |
| dailymail.co.uk | 107.0 | 77.6 | -29.4 | -27.5% |
| independent.co.uk | 152.4 | 134.9 | -17.6 | -11.5% |
| cnn.com | 49.4 | 33.7 | -15.8 | -31.9% |
| express.co.uk | 34.1 | 21.3 | -12.8 | -37.5% |
| bloomberg.com | 47.2 | 34.6 | -12.7 | -26.8% |
| metro.co.uk | 41.0 | 28.6 | -12.3 | -30.1% |
| inews.co.uk | 14.4 | 5.8 | -8.6 | -59.9% |
| aljazeera.com | 18.5 | 10.9 | -7.5 | -40.9% |
| washingtonpost.com | 19.5 | 12.6 | -6.9 | -35.6% |
| usatoday.com | 19.7 | 12.8 | -6.9 | -34.9% |
| reuters.com | 22.4 | 16.4 | -6.0 | -26.9% |
| news.sky.com | 38.9 | 33.2 | -5.6 | -14.5% |
| manchestereveningnews.co.uk | 15.9 | 10.3 | -5.6 | -35.1% |
| mirror.co.uk | 78.0 | 72.6 | -5.4 | -6.9% |
| cnbc.com | 23.0 | 18.3 | -4.7 | -20.6% |
| thetimes.co.uk | 18.4 | 13.8 | -4.6 | -25.2% |
| irishtimes.com | 7.4 | 2.9 | -4.5 | -60.7% |
Vanity Fair
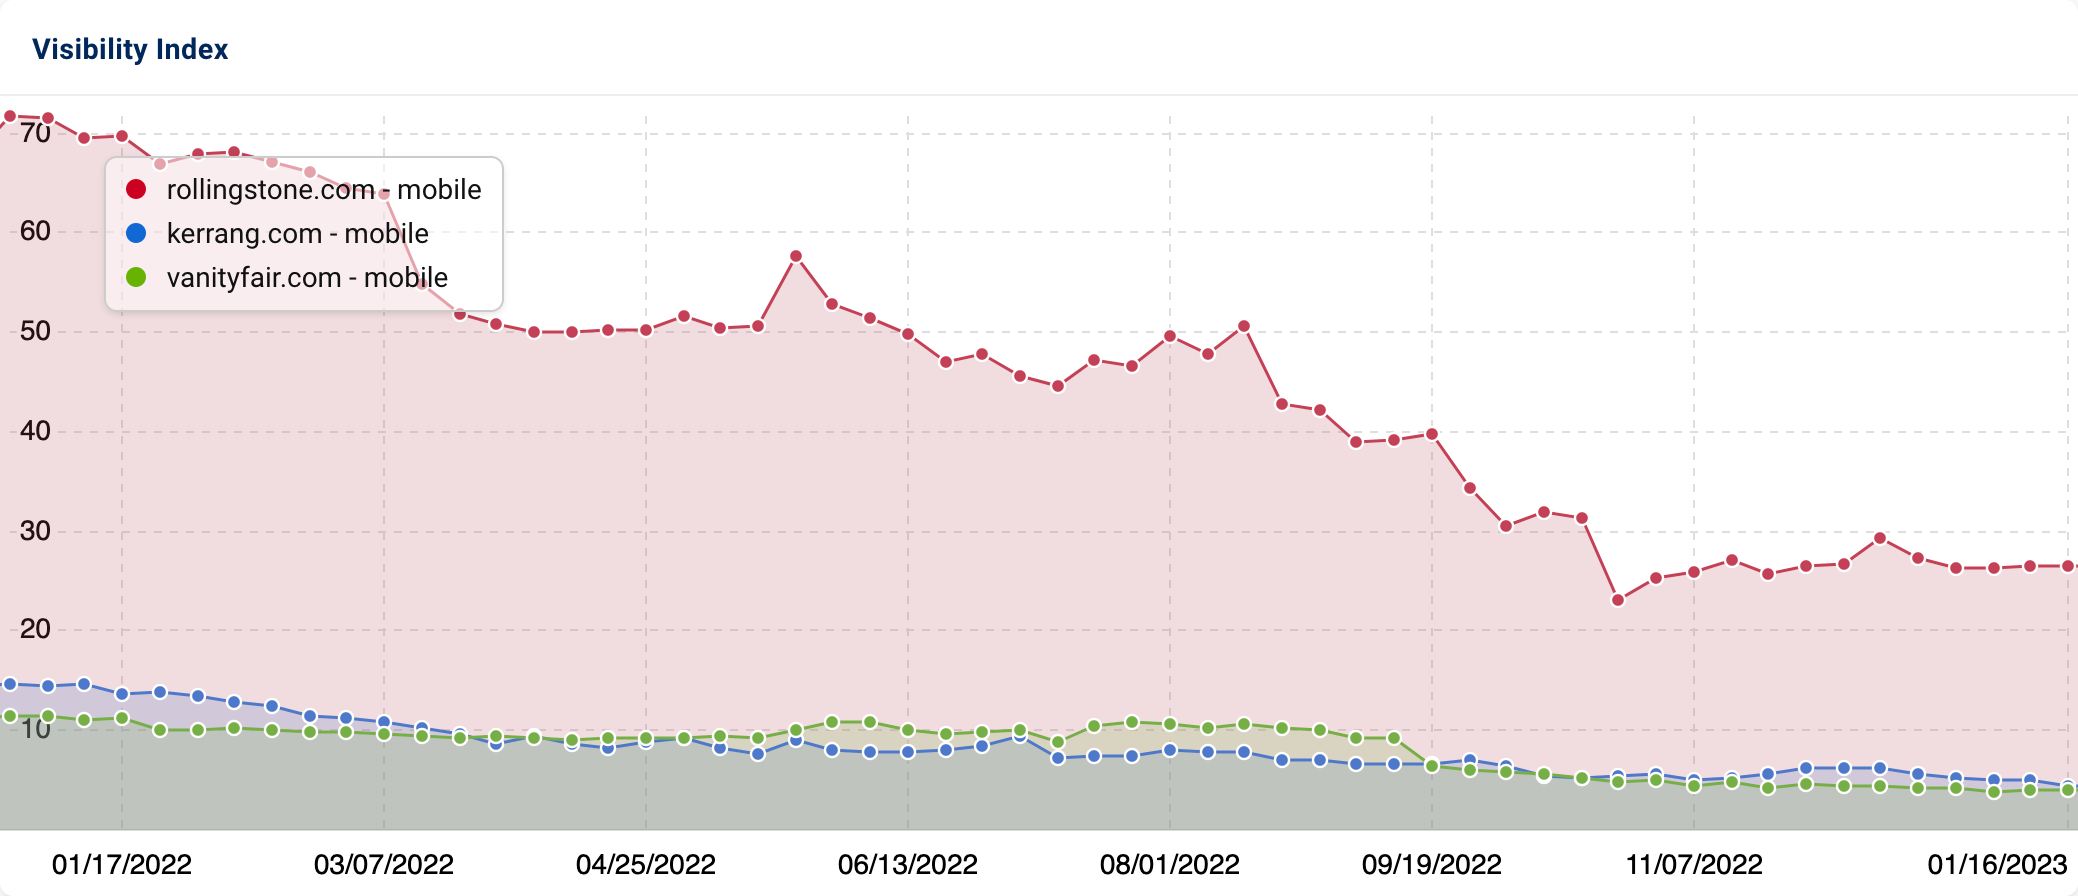
As for entertainment domains, vanityfair.com’s visibility suffered the most (-66.1%). Kerrang.com (-65.6%) and rollingstone.com (-63.1% / -45.2 VI points) also experienced a significant decrease.
Vanity Fair is a US magazine owned by Condé Nast covering fashion, pop culture and current affairs.
The decrease in vanityfair.com’s visibility commenced during the core update in September. It continued tanking following the September Product Review and the October Spam Updates. Over the course of under 1 month, the domain’s Visibility Index score fell from 9.2 to 5.3.
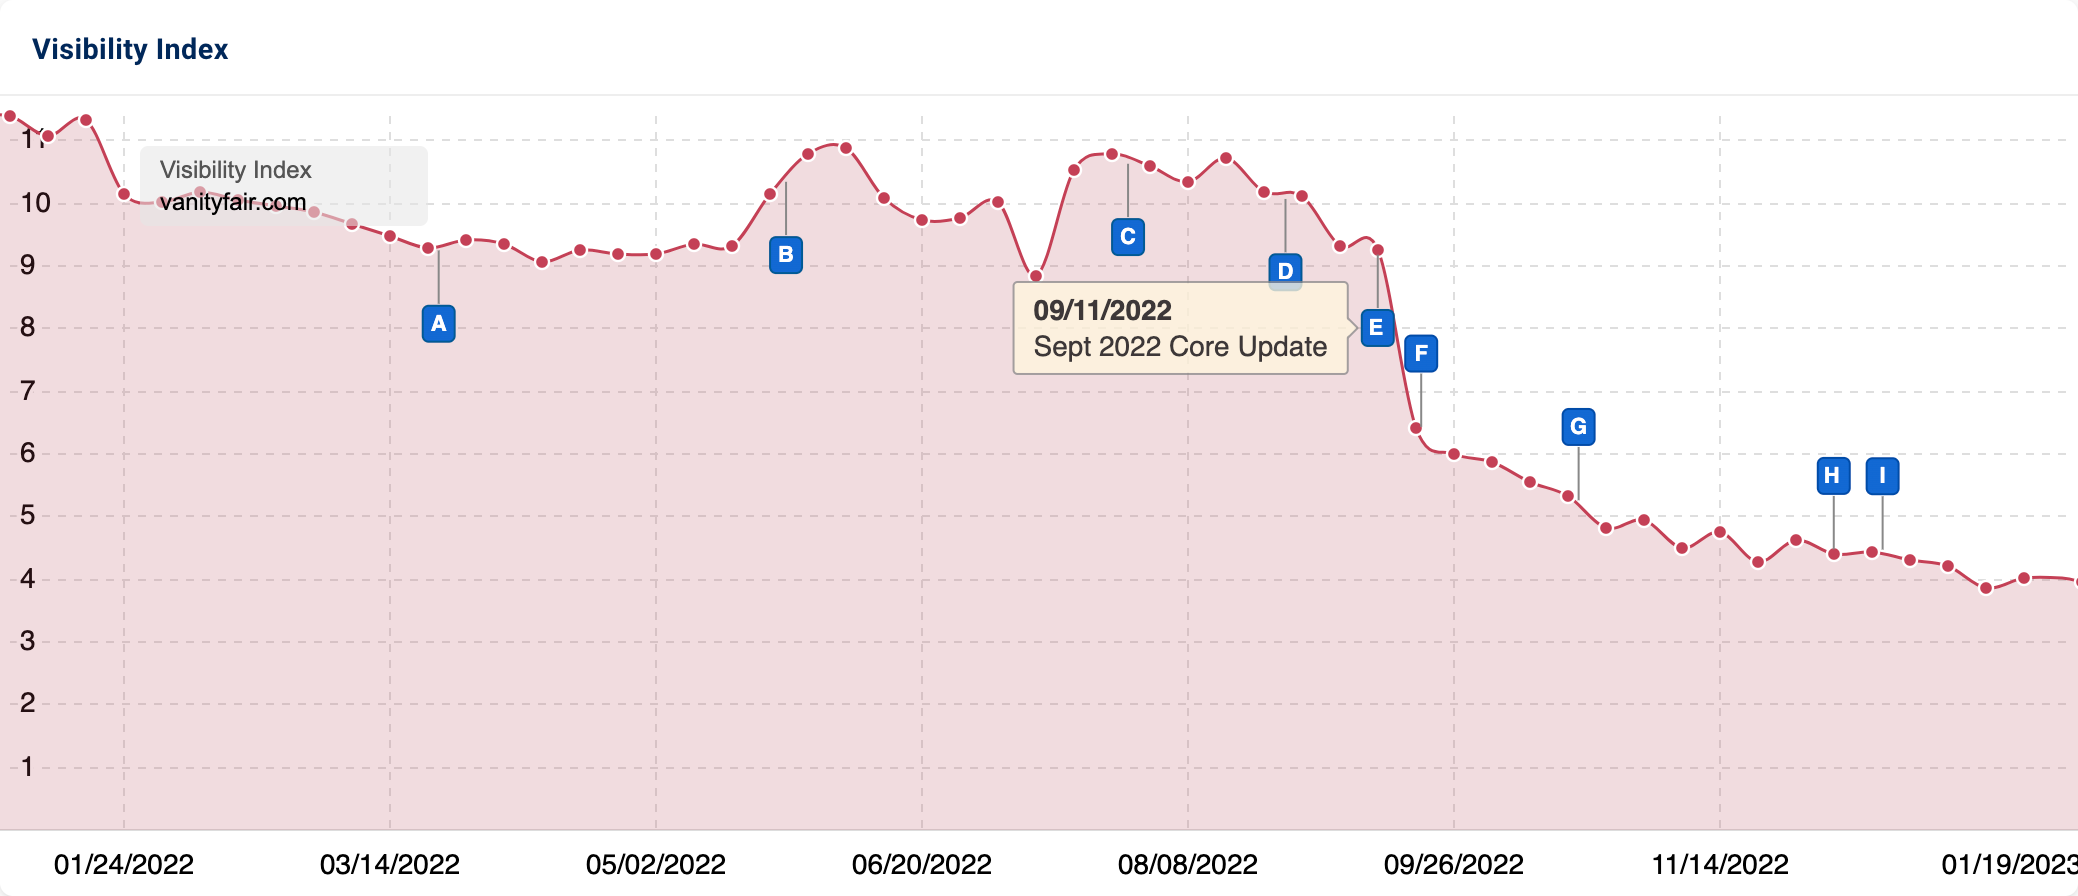
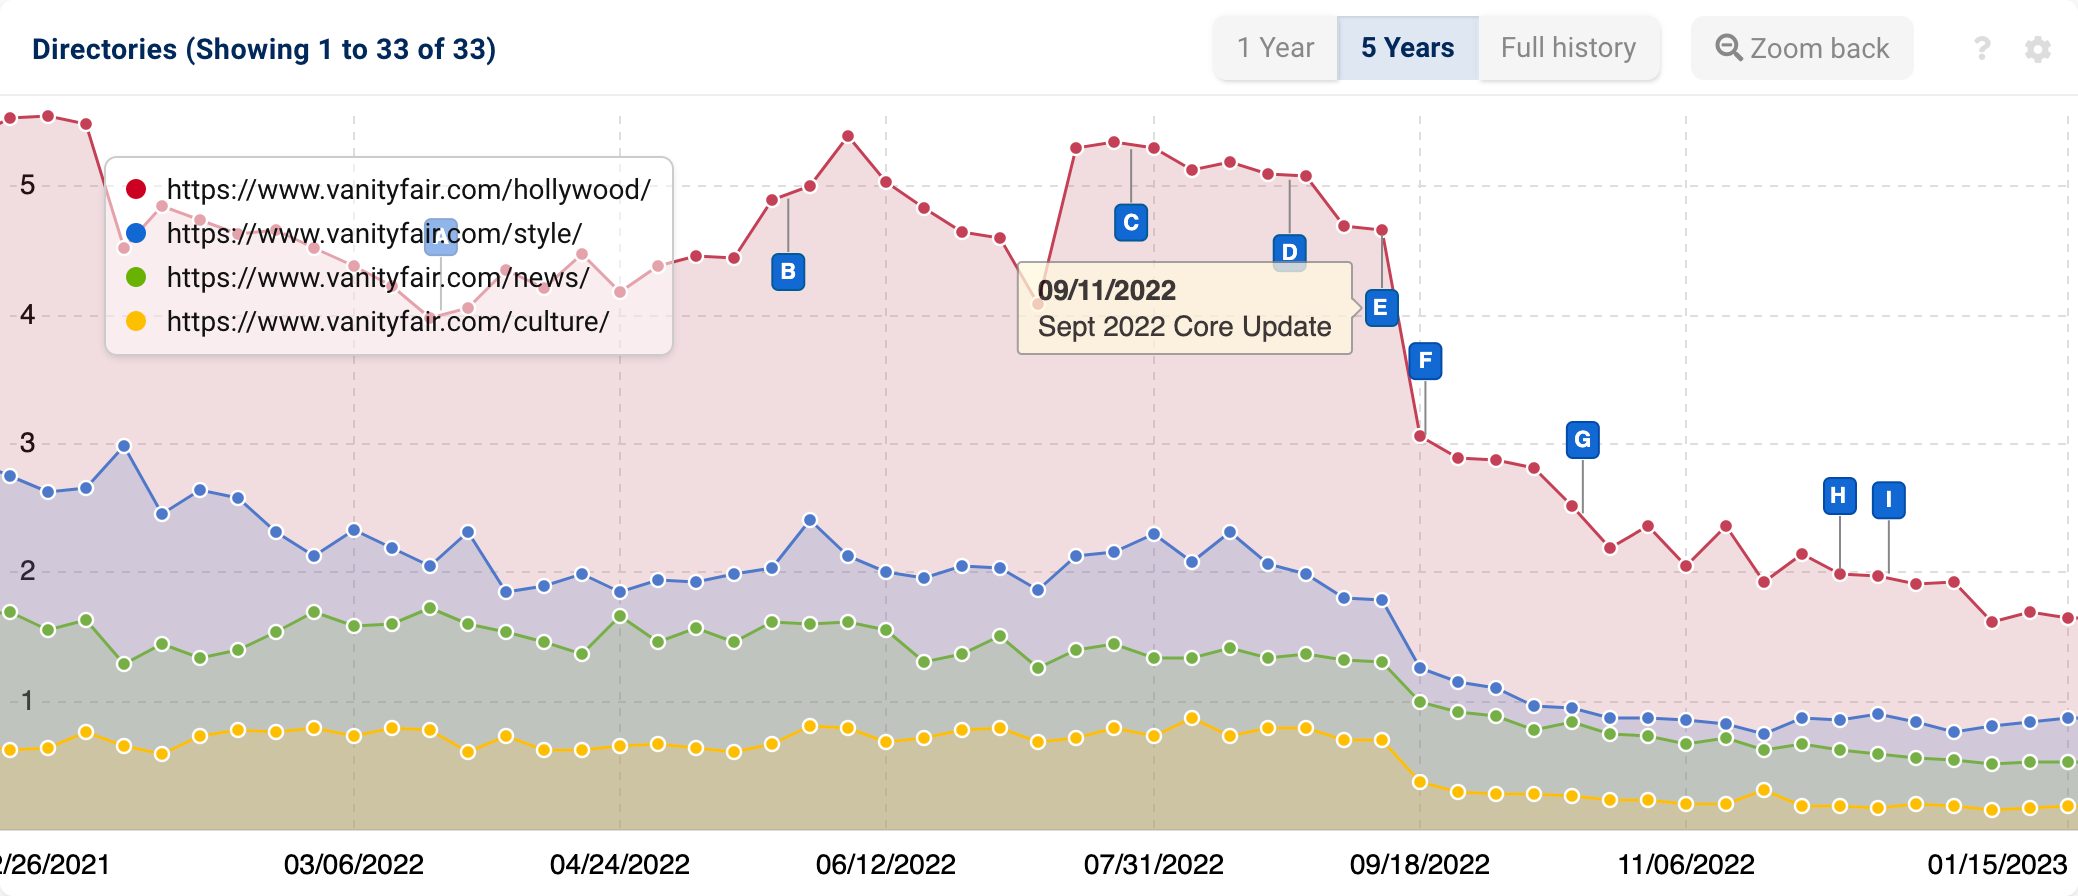
“/hollywood”, containing celebrity and cinema news, was the main source of the domain’s decrease.
The performance trend of this section also aligned with those observed for vanityfair.com as a whole. The July Core & Helpful Content Updates resulted in some instability before visibility dropped.
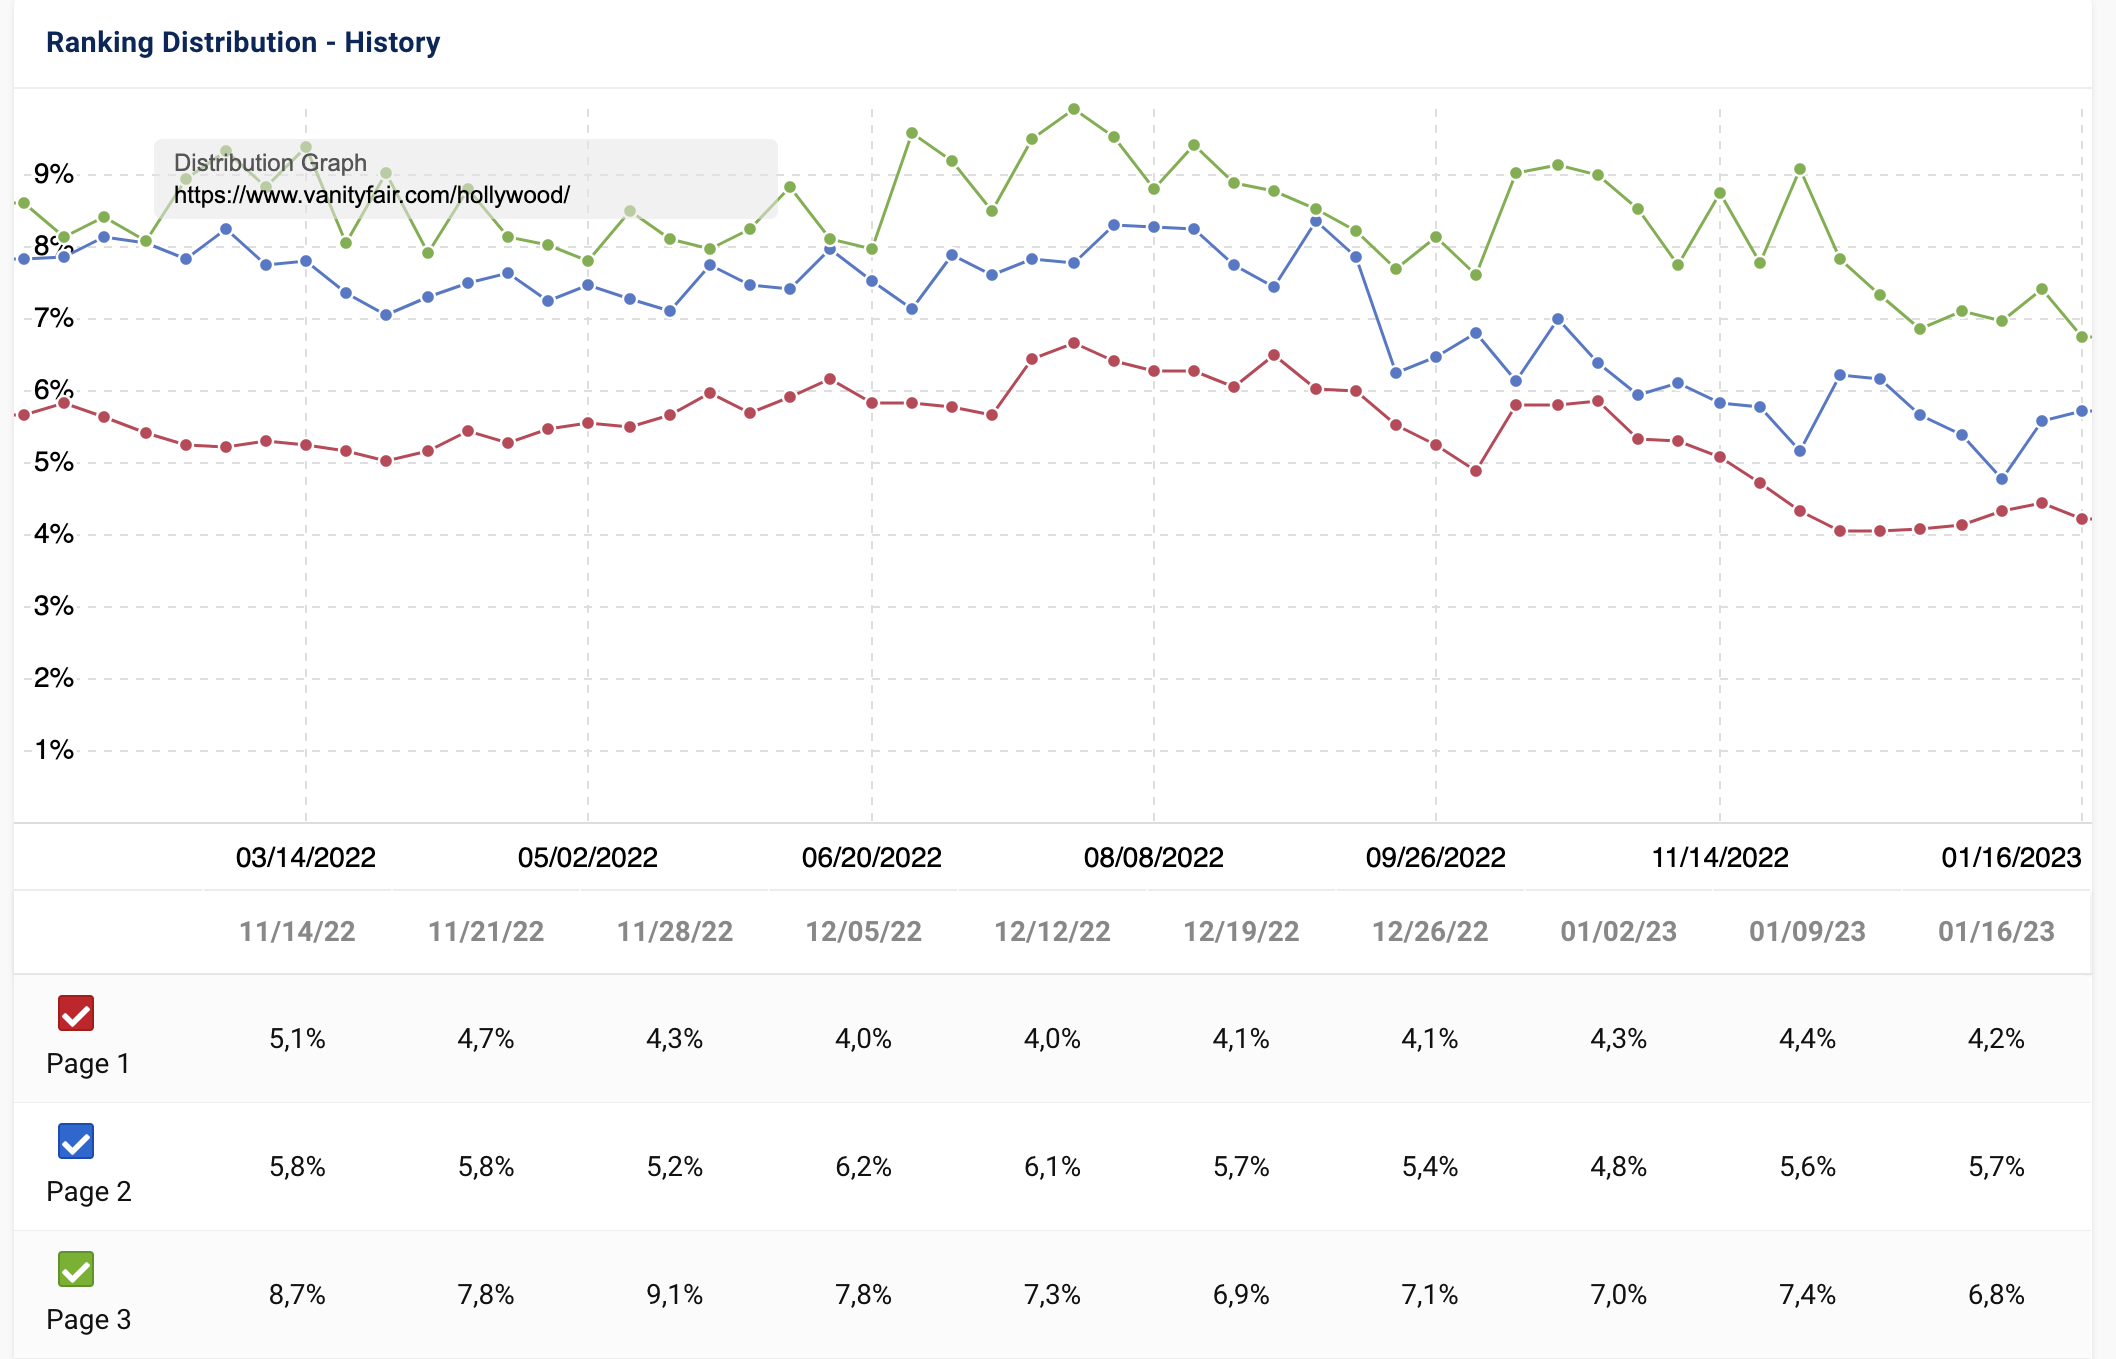
YoY, “/hollywood” lost rankings for 96,480 keywords and saw decreases for a further 56,714. Over the 12 months, the section forfeited 5% of its page 1 to 3 rankings. The largest percentage losses were across pages 1 & 2 (2% drop-off per result page).
Examining the design of the website confirms that there were no major changes. But, there were some changes to the site’s approach to AMP (a common theme in this article!). Since Google announced that AMP is no longer given preferential treatment in June 2021, publishers have either stuck with it or implemented 301 redirects to non-AMP content. In the case of Vanity Fair, it appears that they have discontinued their support for it.
It would be easy to jump to the conclusion that migrating away from AMP has contributed to the domain’s loss. But, this is actually not the case. Analysing URL Changes data confirms that this has had little impact. In fact, it highlights that vox.com and theguardian.com have suffered by retaining AMP.
This discovery implies that Vanity Fair’s visibility score decrease is down to content and/or other technical factors. Google continues to emphasise the importance of E-E-A-T for organic ranking. This has also been channelled through other means, such as the Helpful Content Update. As magazines are comprised of both fact and opinion, it begs the question of whether the search giant has deemed Vanity Fair as having poor quality content. Additionally, there is a possibility hasn’t Vanity Fair optimised their site’s page speed and experience to maximum potential.
Losses for learning resources
Education has been no exception to Google’s wrath in 2022. It feels like only yesterday that we were in the midst of the pandemic and the algorithms were favouring educational sites. But what exactly has happened in the last 12 months?
Lumen Learning
The biggest loser in the education sector was lumenlearning.com. Lumen Learning is a US company that provides higher education courses and resources. YoY, its organic visibility has dropped by 67.6% / 14.7 VI points. The core update in May initiated a significant decrease which has yet to see major signs of improvement.
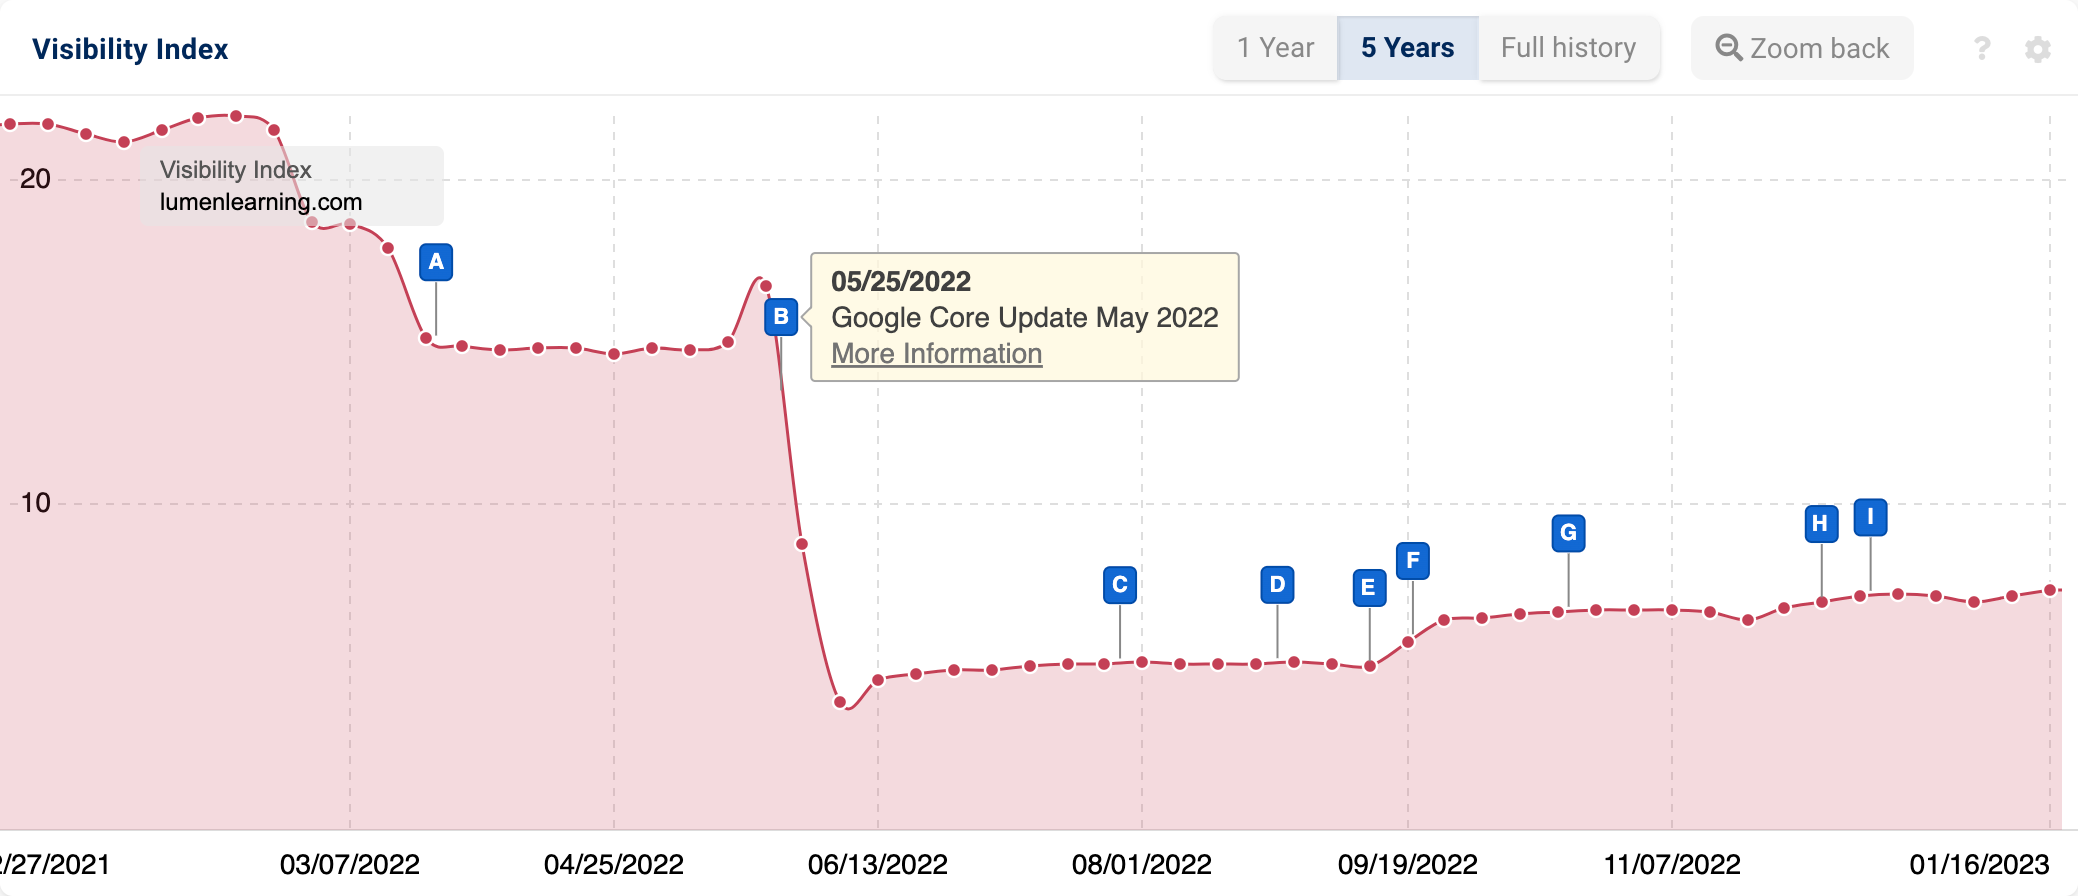
Delving into lumenlearning.com’s directories shows little concern. Compared to January 2022, many of their course subfolders have seen improved visibility. This suggests a wider content or technical change could be at play.
Reviewing how the homepage looked in January 2022 confirms that the site has undergone design and structural changes.
Analysing the different page versions highlights the introduction of best practices. These include an improved navigation, clearer CTAs and replacing image-based headings with HTML. This indicates that during the year, Lumen Learning decided to put more energy into the site’s SEO & UX. Yet, despite this, 2022 ended on an SEO low for the brand.
The Ranking Distribution data shows that following the core update in May, lumenlearning.com’s page 1 to 3 rankings declined. Over the period of a week, the percentage of page 1 keywords decreased from 17% to 9%, and page 2 keywords from 15% to 9%.
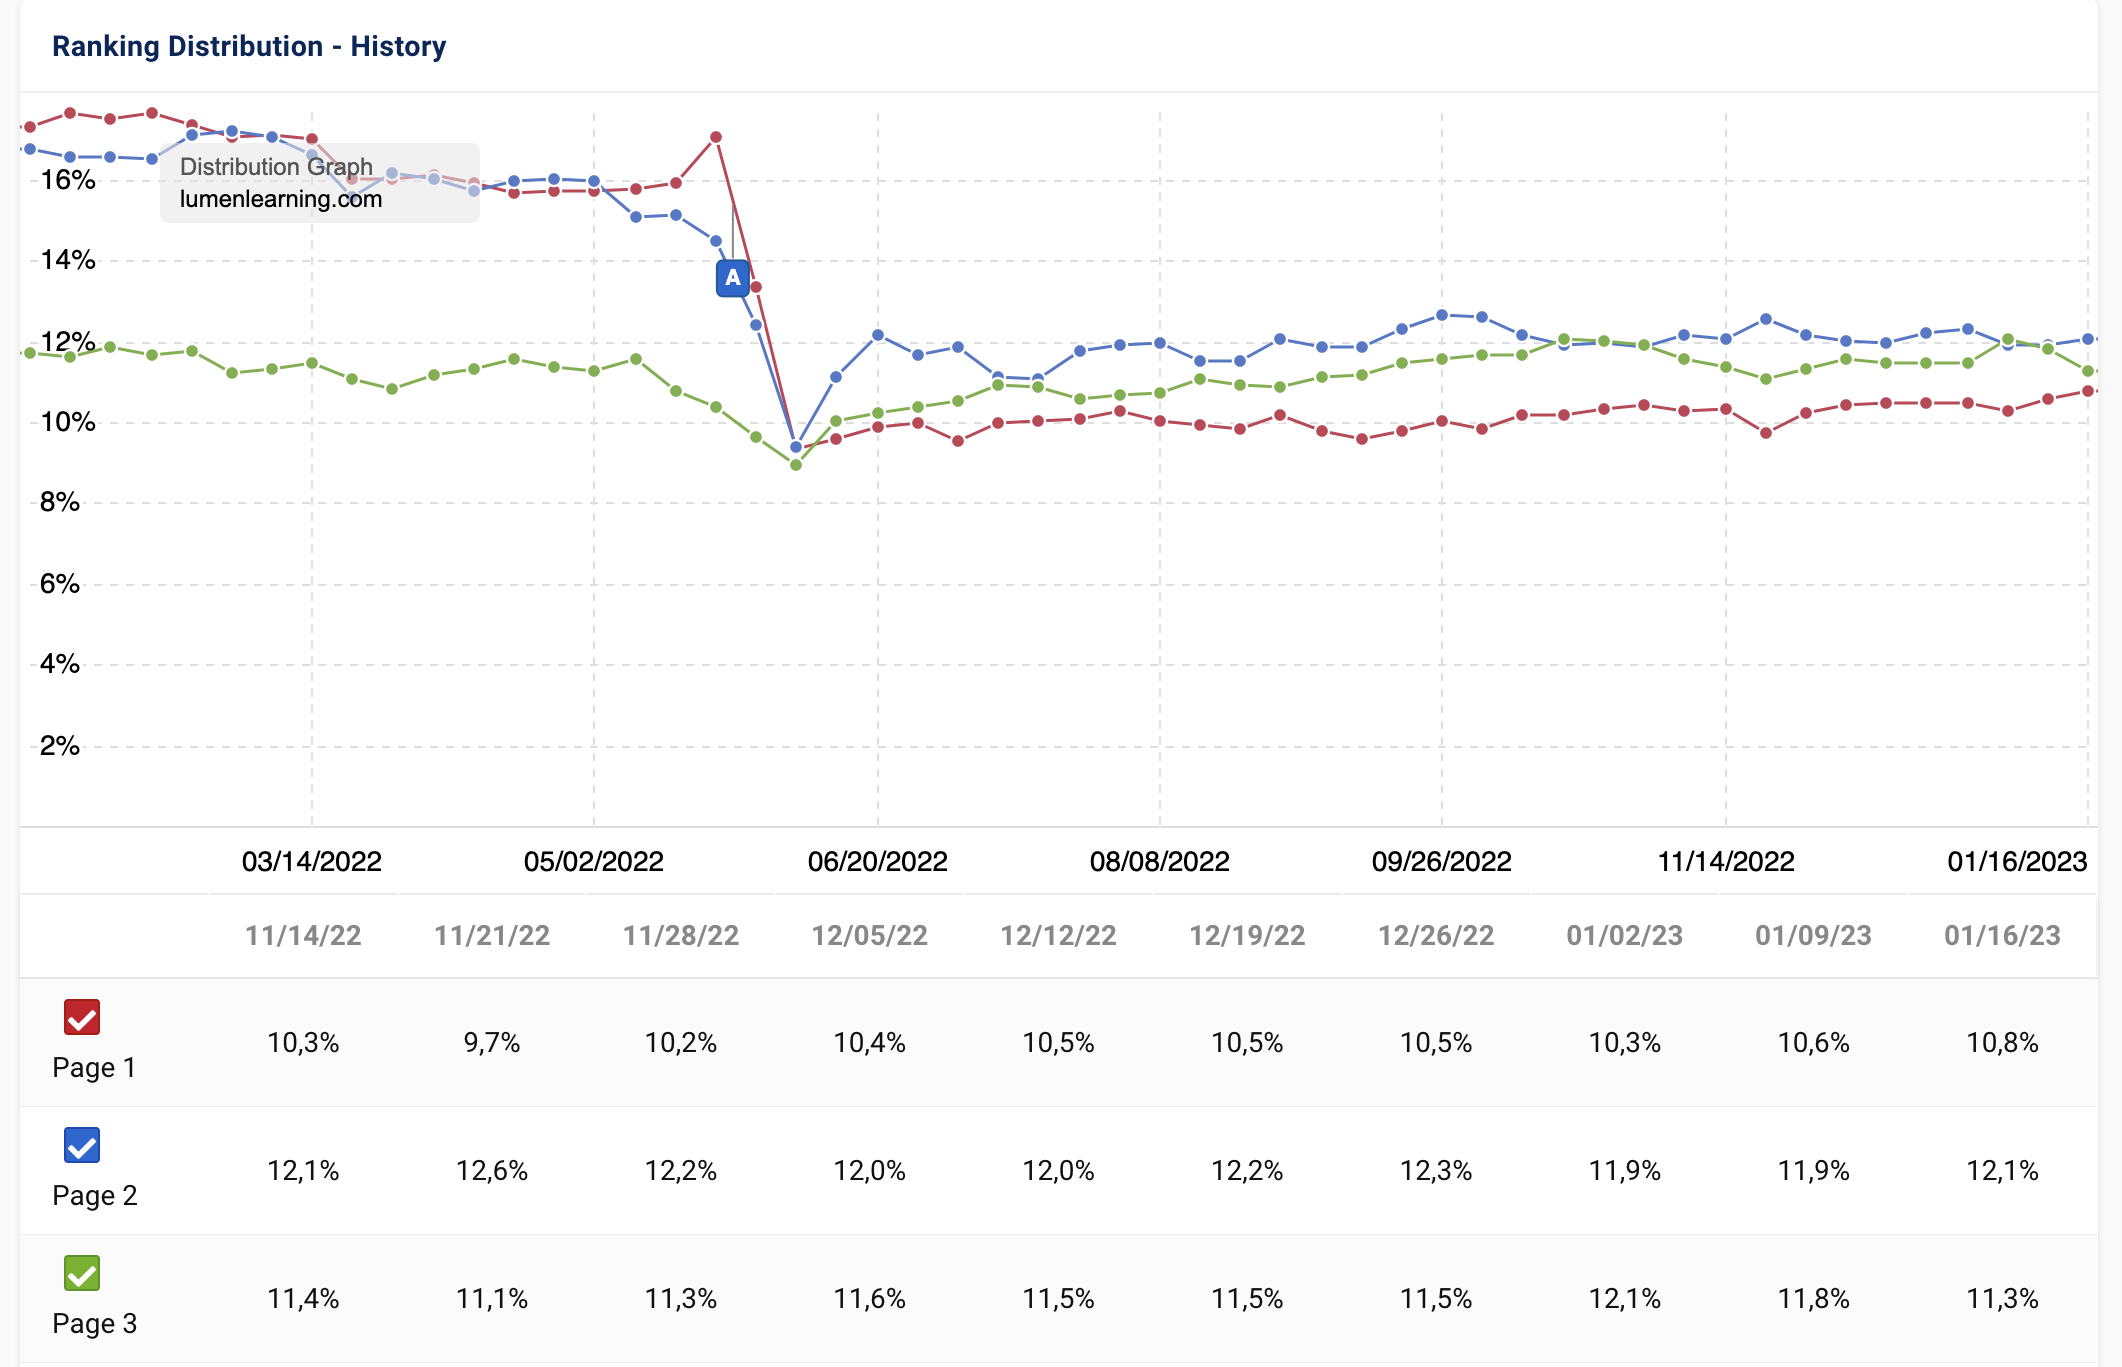
Our URL Change tool also indicates that particular course types have lost rankings. These are more complex subjects including maths, chemistry and physics.
Spot-checking a random selection of URLs confirms that there is a valid reason. Many of the ranking losses are a consequence of 301 redirects to external domains. These domains include coursehero.com and quillbot.com, owned by Course Hero, Inc. After browsing the site and discovering this change, EdSurge wrote an article (in July). This article confirmed that the Lumen Learning team had kept the change close to their chests.
Whilst Lumen Learning still has its own selection of learning resources, the redirects will be providing potential ranking opportunities to these external education sites instead.
These insights suggest that Lumen Learning lacks expertise in certain educational topics vs competitors. So, Google may be opting to rank stronger competitor content higher within the SERPs.
Duo Lingo
Their TikTok game may be strong, but Duo Lingo’s SEO tactics lacked strength in 2022. The popular language education app experienced a visibility decrease of 66.5% YoY. Verdammt!
Like lumenlearning.com, duolingo.com suffered at the hands of the May Core Update. The site was fortunate to be somewhat uplifted by the Helpful Content and Spam Updates, but to nowhere near the levels observed in early 2022.
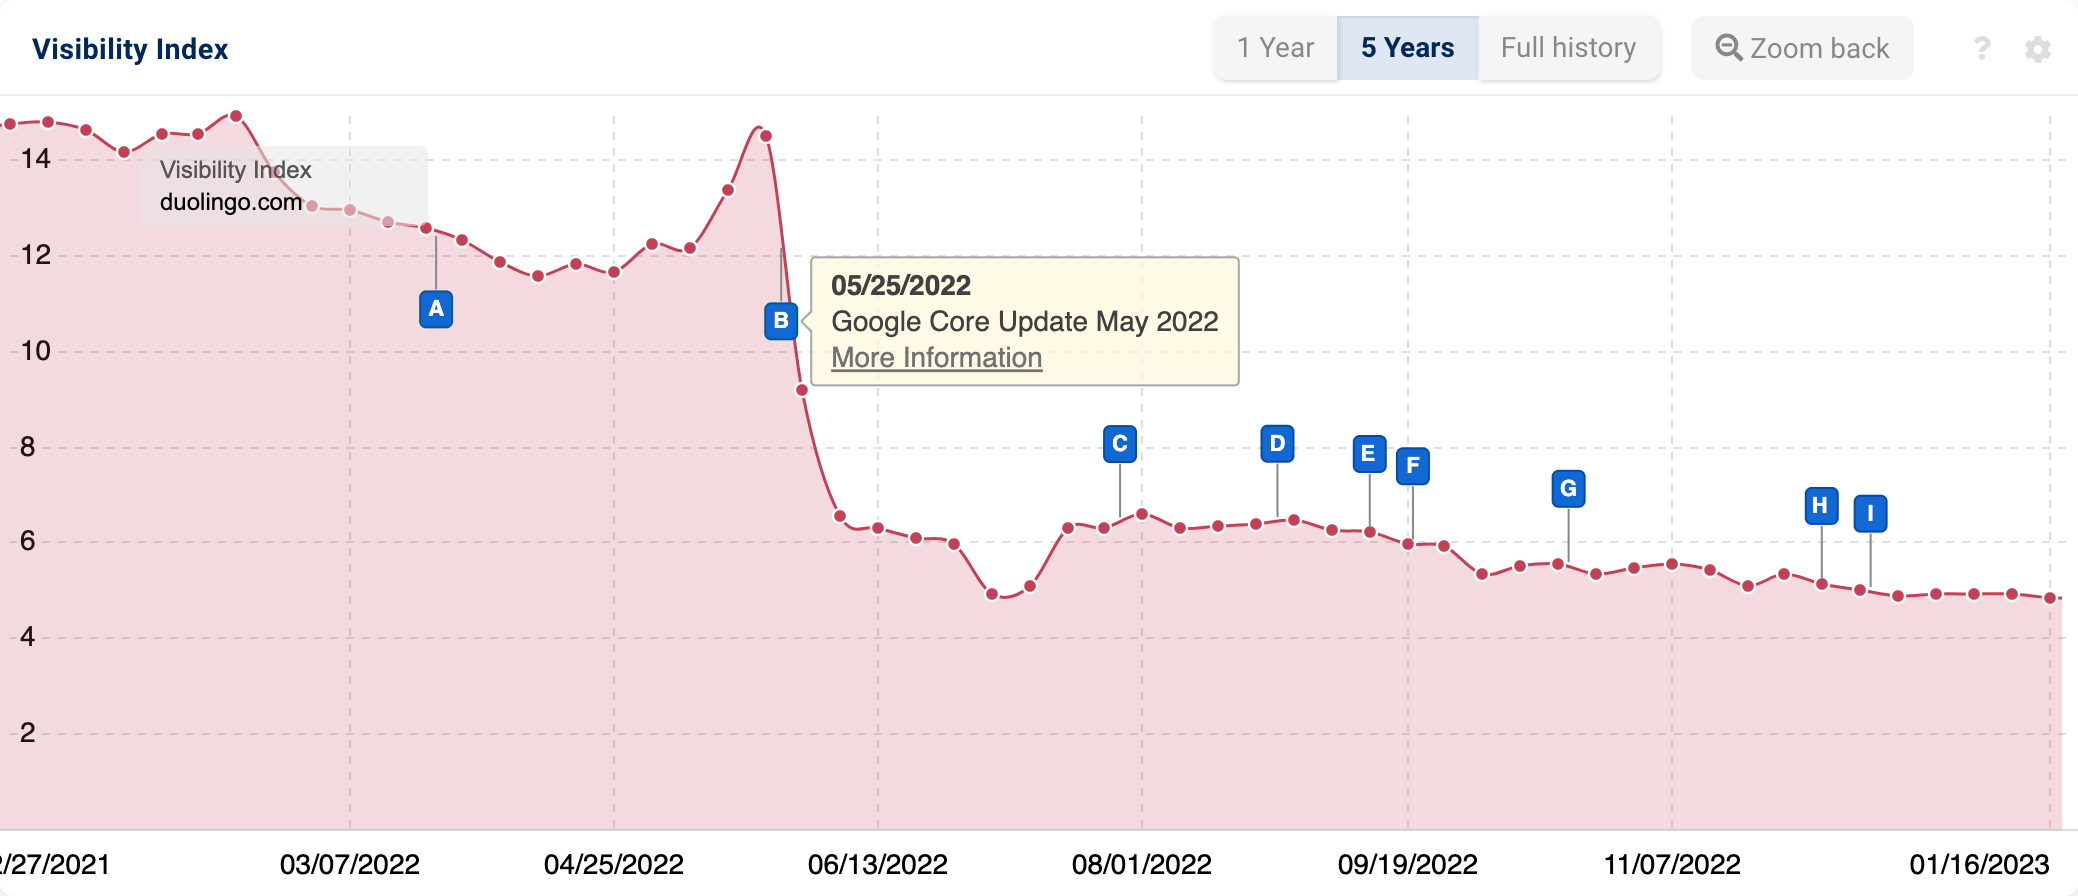
So what led to duolingo.com’s organic search decline? Further investigation shows that whilst “/courses” has thrived, “/comment” lost traction. This directory is part of their forum subdomain.
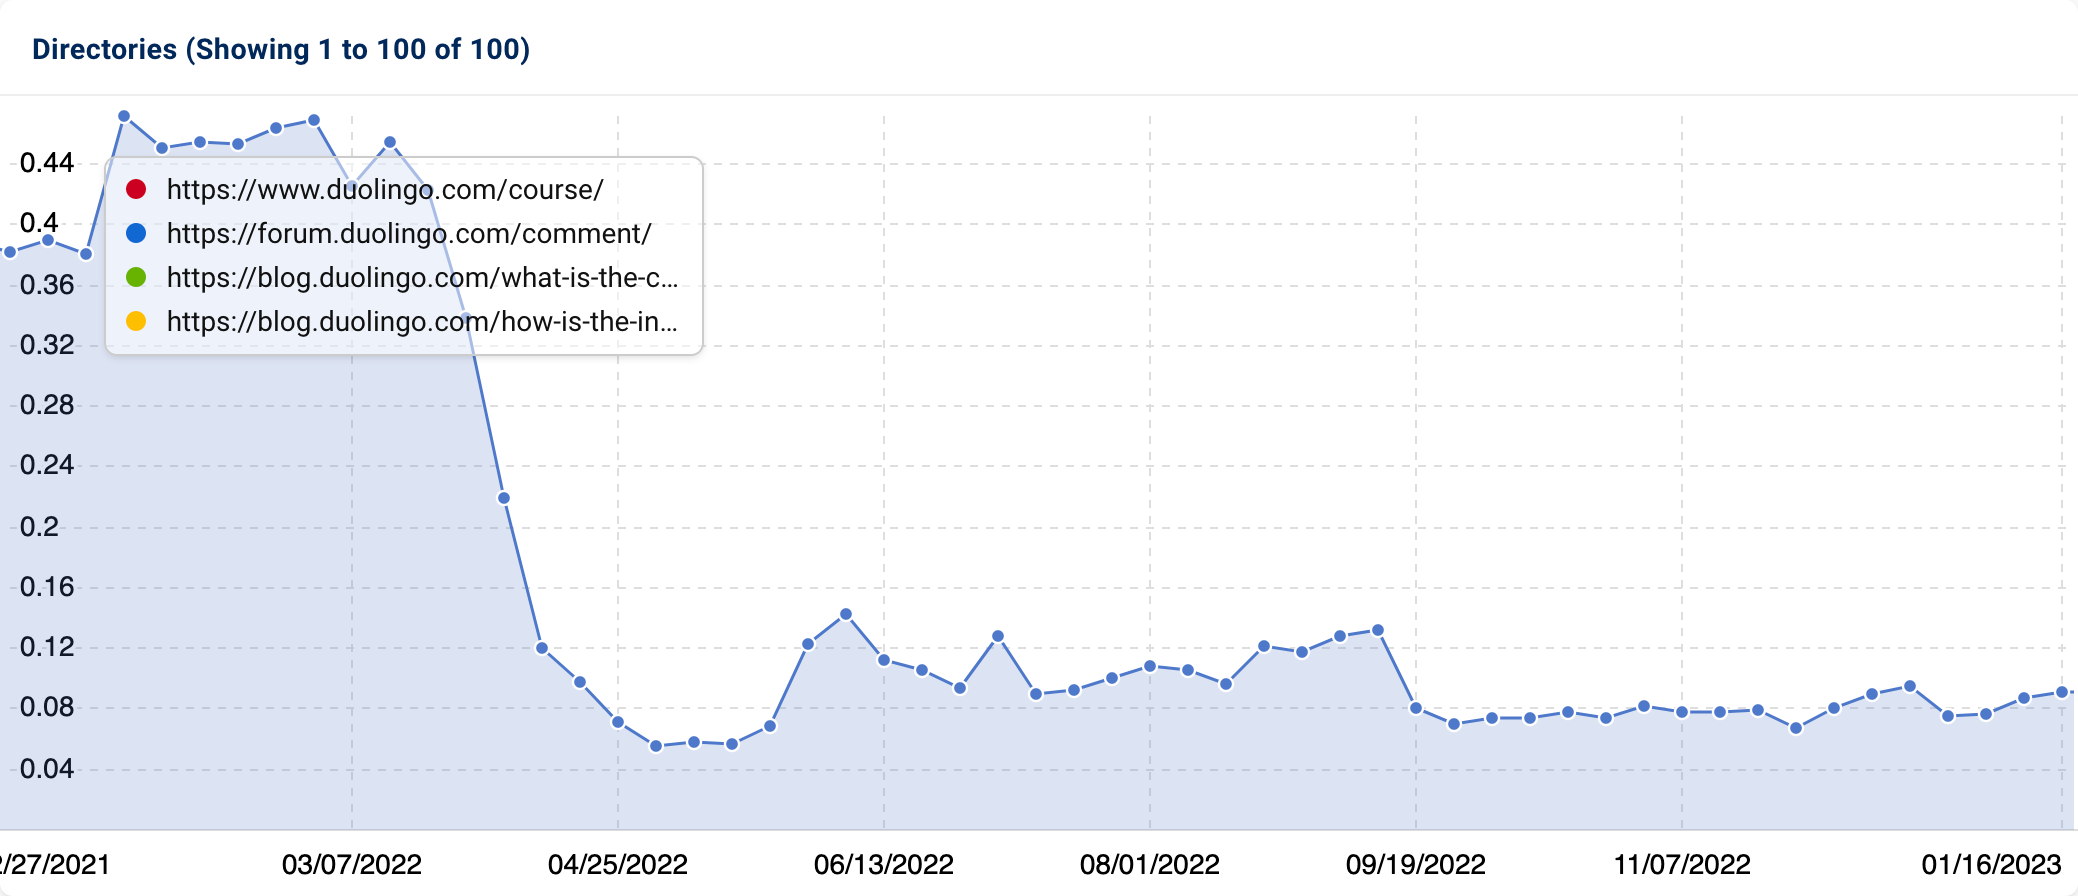
Loading the forum subdomain has confirmed that Duo Lingo has opted to deactivate it. This sunsetting was also announced on their support subdomain back in March.
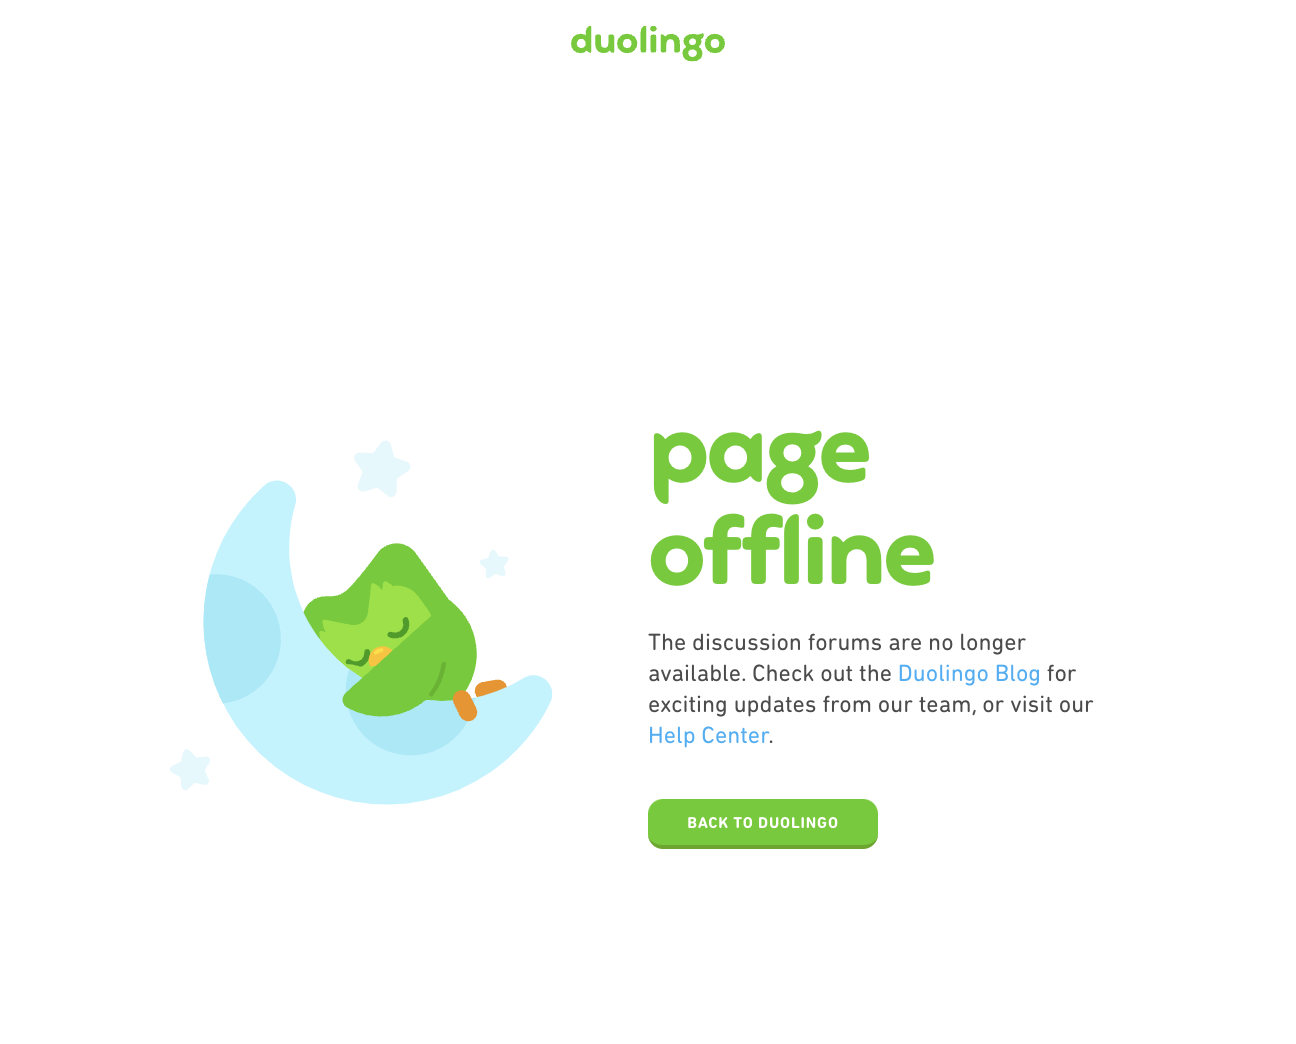
Whilst the company did not provide a reason why, it is safe to say that when it comes to UGC (user-generated content), it is the definition of a blessing AND a curse! If a forum platform includes certain limitations and user activity is well managed, it can be an SEO’s dream. Though, in stark contrast, they can introduce major content quality and duplicate content issues.
Was managing the forum too resource-intensive? Was the content quality and usefulness debatable? Was it being under-utilised by users? Who knows. Any of these could be justification for the section’s deactivation.
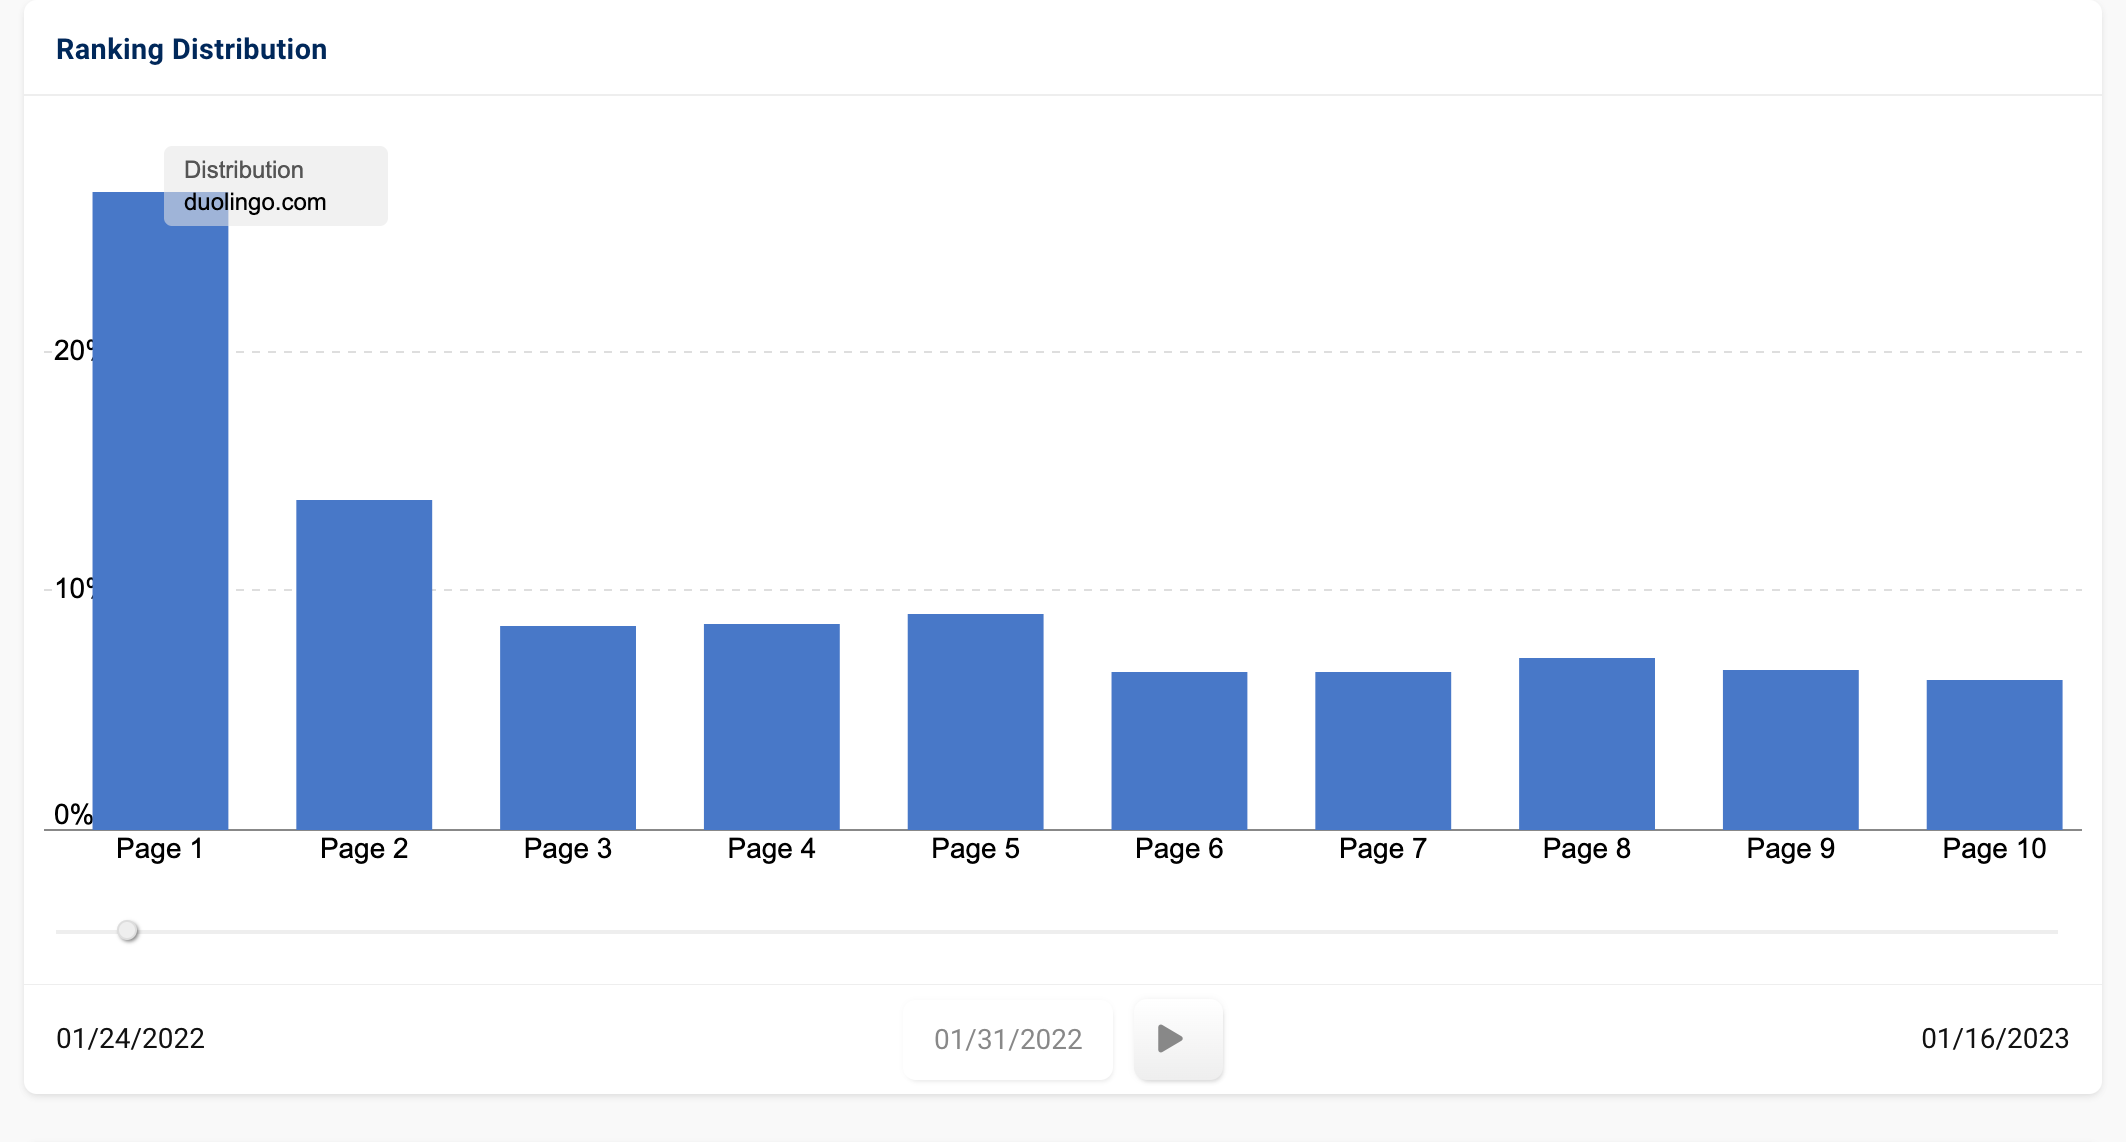
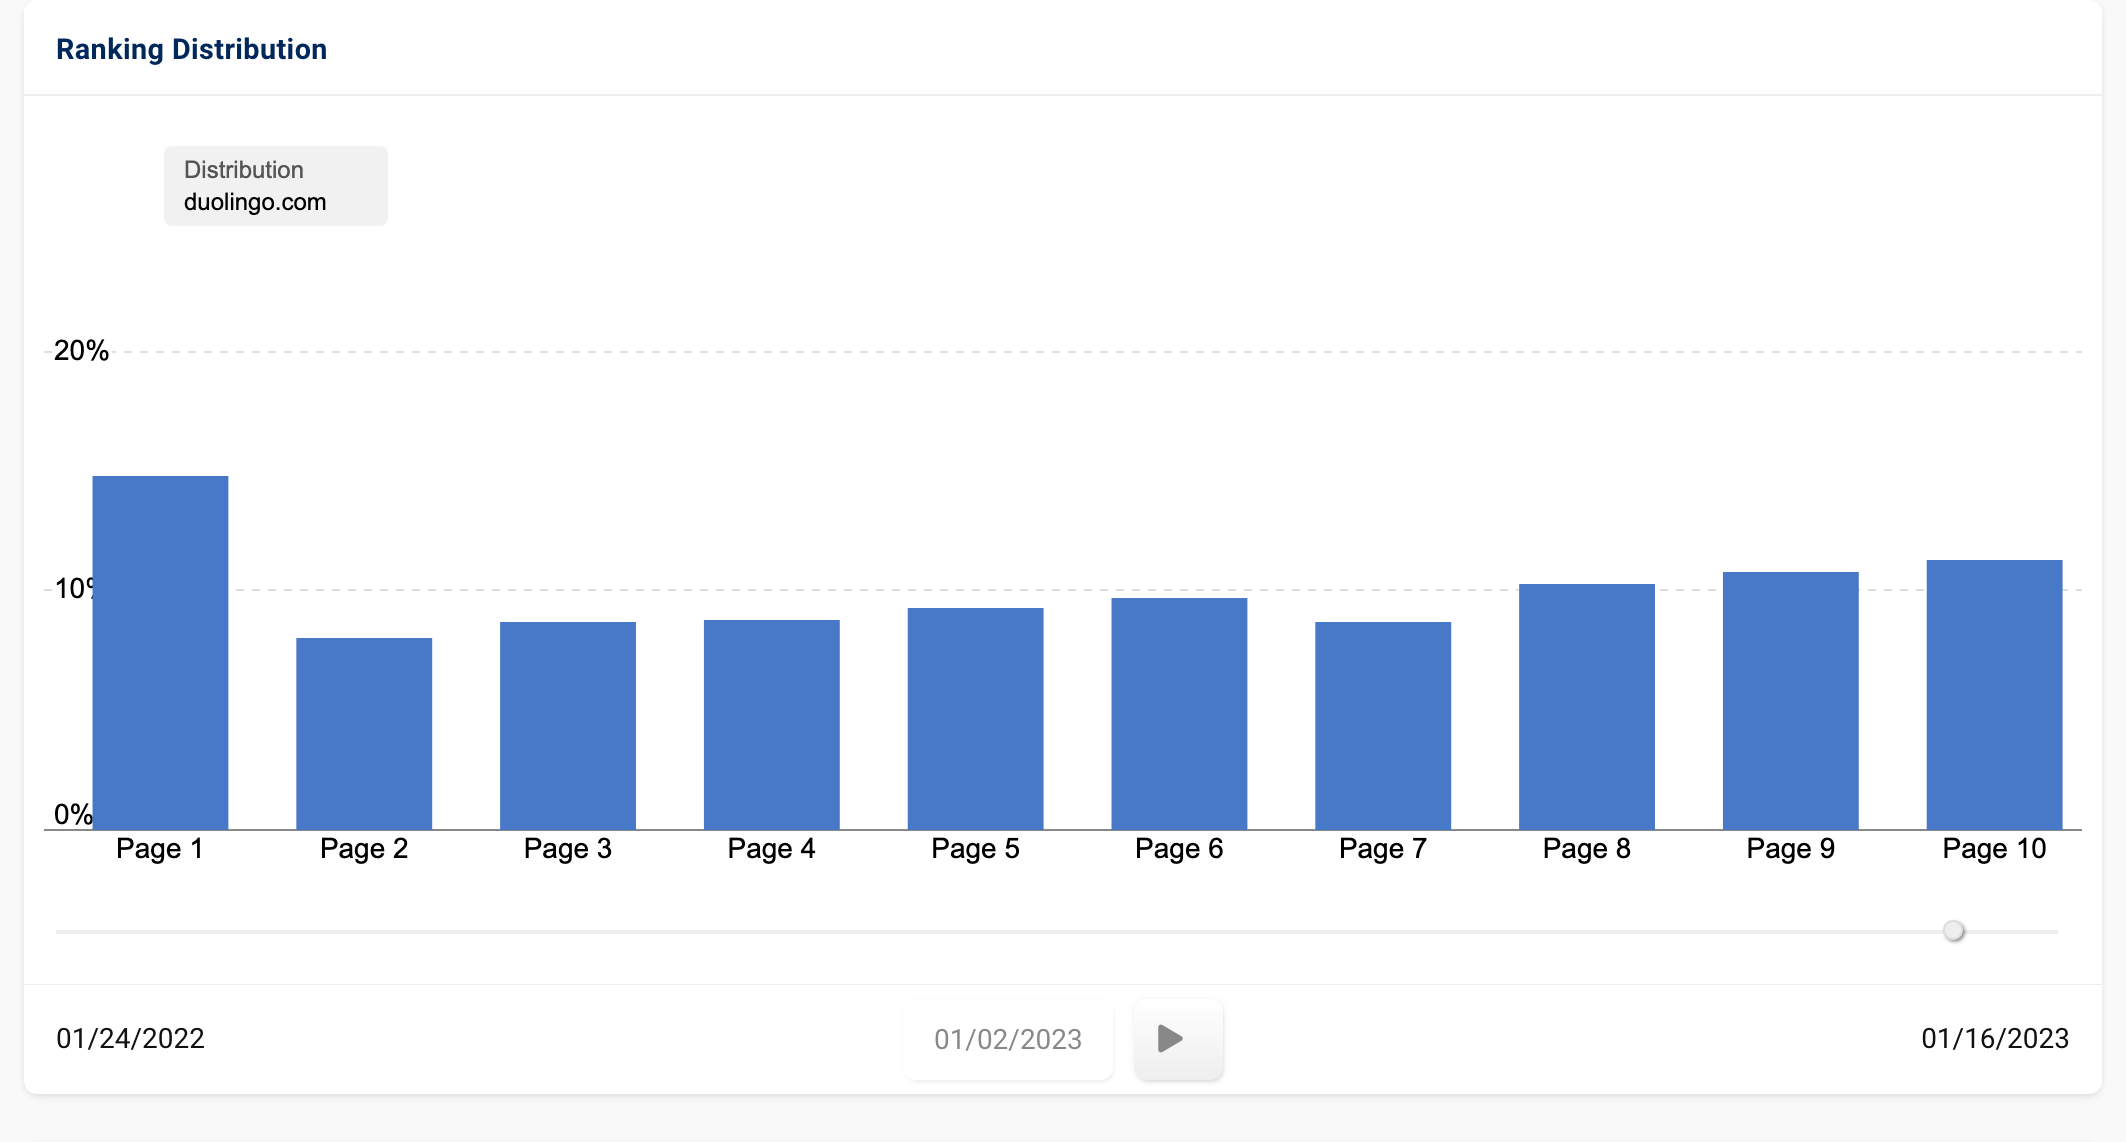
Whilst interesting, the removal of this feature isn’t the sole cause of the site’s SEO woes. In fact, if we look at the Ranking Changes data, we can see that positions decreased for 36,428 keywords, with a further 92,462 losing ranking altogether.
The Ranking Distribution graphs also confirm that on 31st January 2022, 27% were rankings on Page 1, 14% on Page 2, and 9% on Page 3.
As of 2nd January 2023, Page 1 rankings have decreased to 15%, Page 2 to 8% and Page 3 to 9%.
31st January 2022:
2nd January 2023:
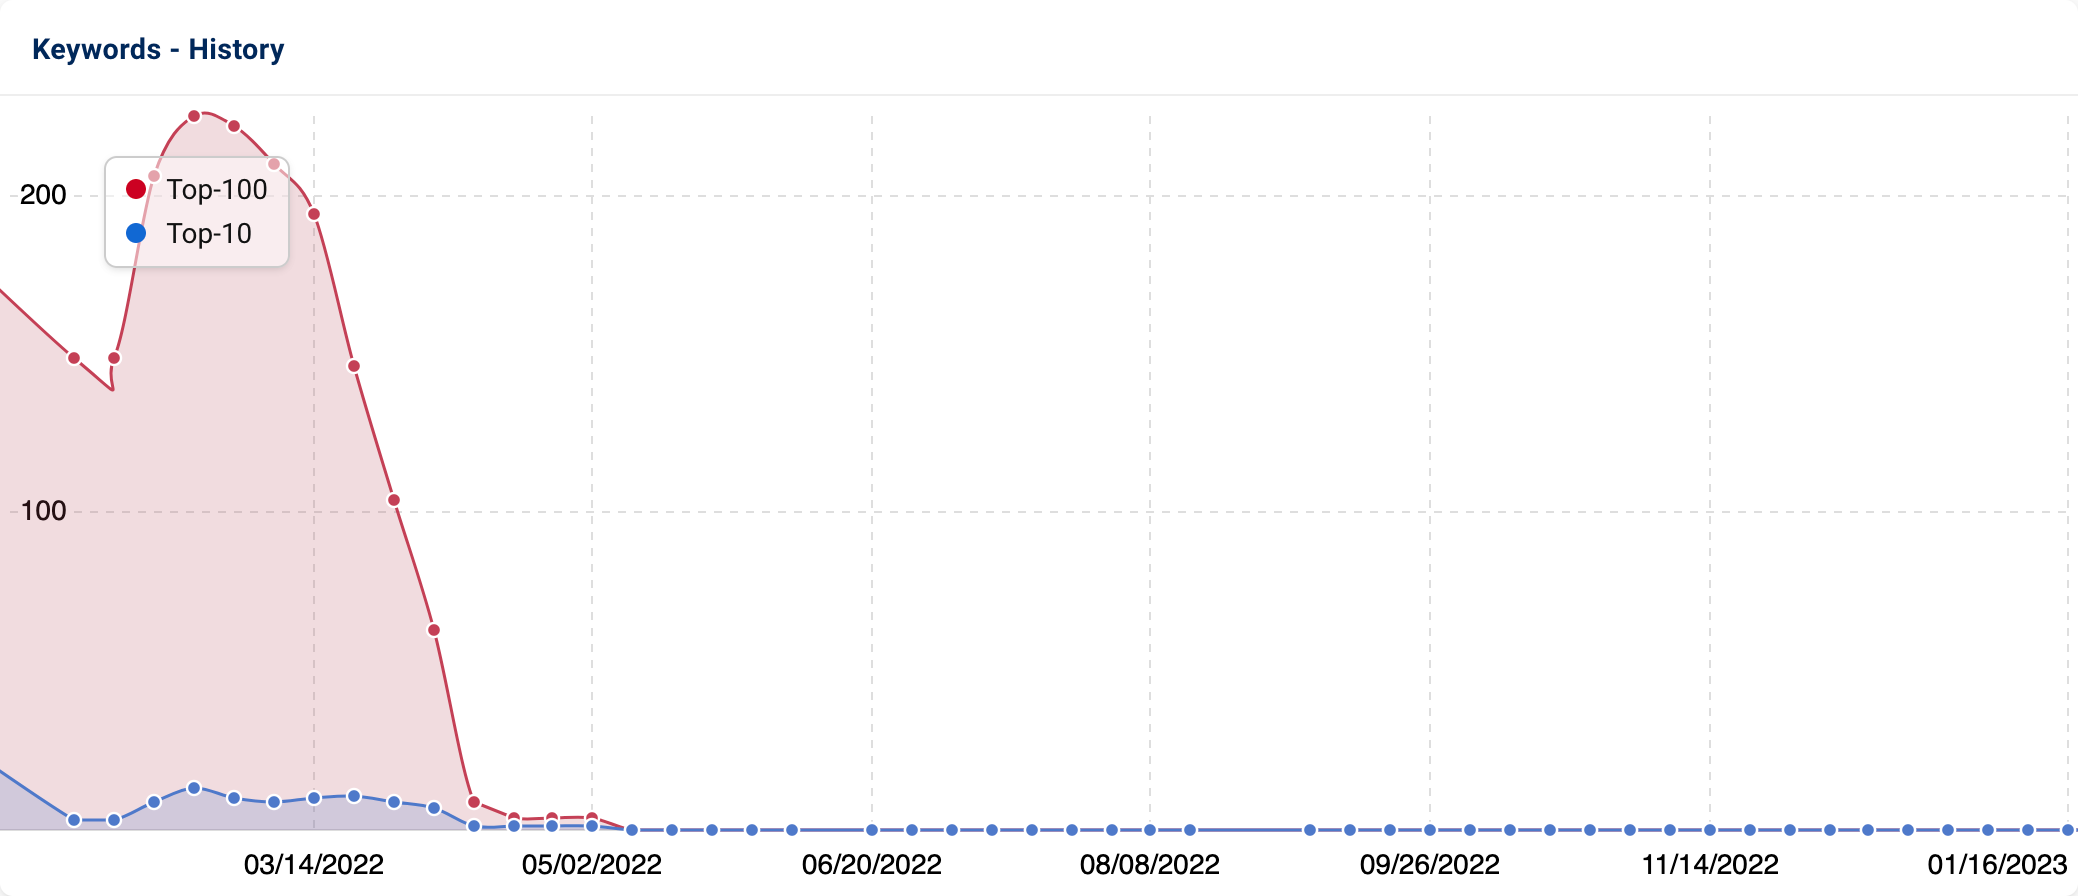
Our URL Changes feature also revealed that many of the ranking losses were for “/dictionary” pages. This subfolder contained dictionaries for a number of foreign languages. These have since been 301 redirected to the most relevant language courses.
From looking at the Ranking History graph, the 301’s resulted in ranking losses for these pages in May.
These are just two contributing factors. Based on the scale of visibility loss, it does seem there is more at play. What exactly? It is hard to determine. Could some technical changes have had a detrimental impact on the domain?
Troughs for Twitter & LinkedIn
In Q3’s edition of Indexwatch, we reflected on the decline of LinkedIn’s UK company pages. This decline continued into Q4, resulting in a YoY visibility decrease of -169.1 VI points.

Linkedin.com’s overall 2022 performance started off strong, with the March Product Review Update having little impact. In May, the domain saw a temporary influx in visibility before the July Product Review update triggered a downfall.
The “/company” directory on the root domain continued to see decreased visibility into Q4. In tandem with this, a new directory started to see increased prominence. This was also “/company” but was a part of the UK-specific subdomain. During Q4 2022, this directory achieved a 194.4% increase in its Visibility Index score (from 10.9 to 32.1).
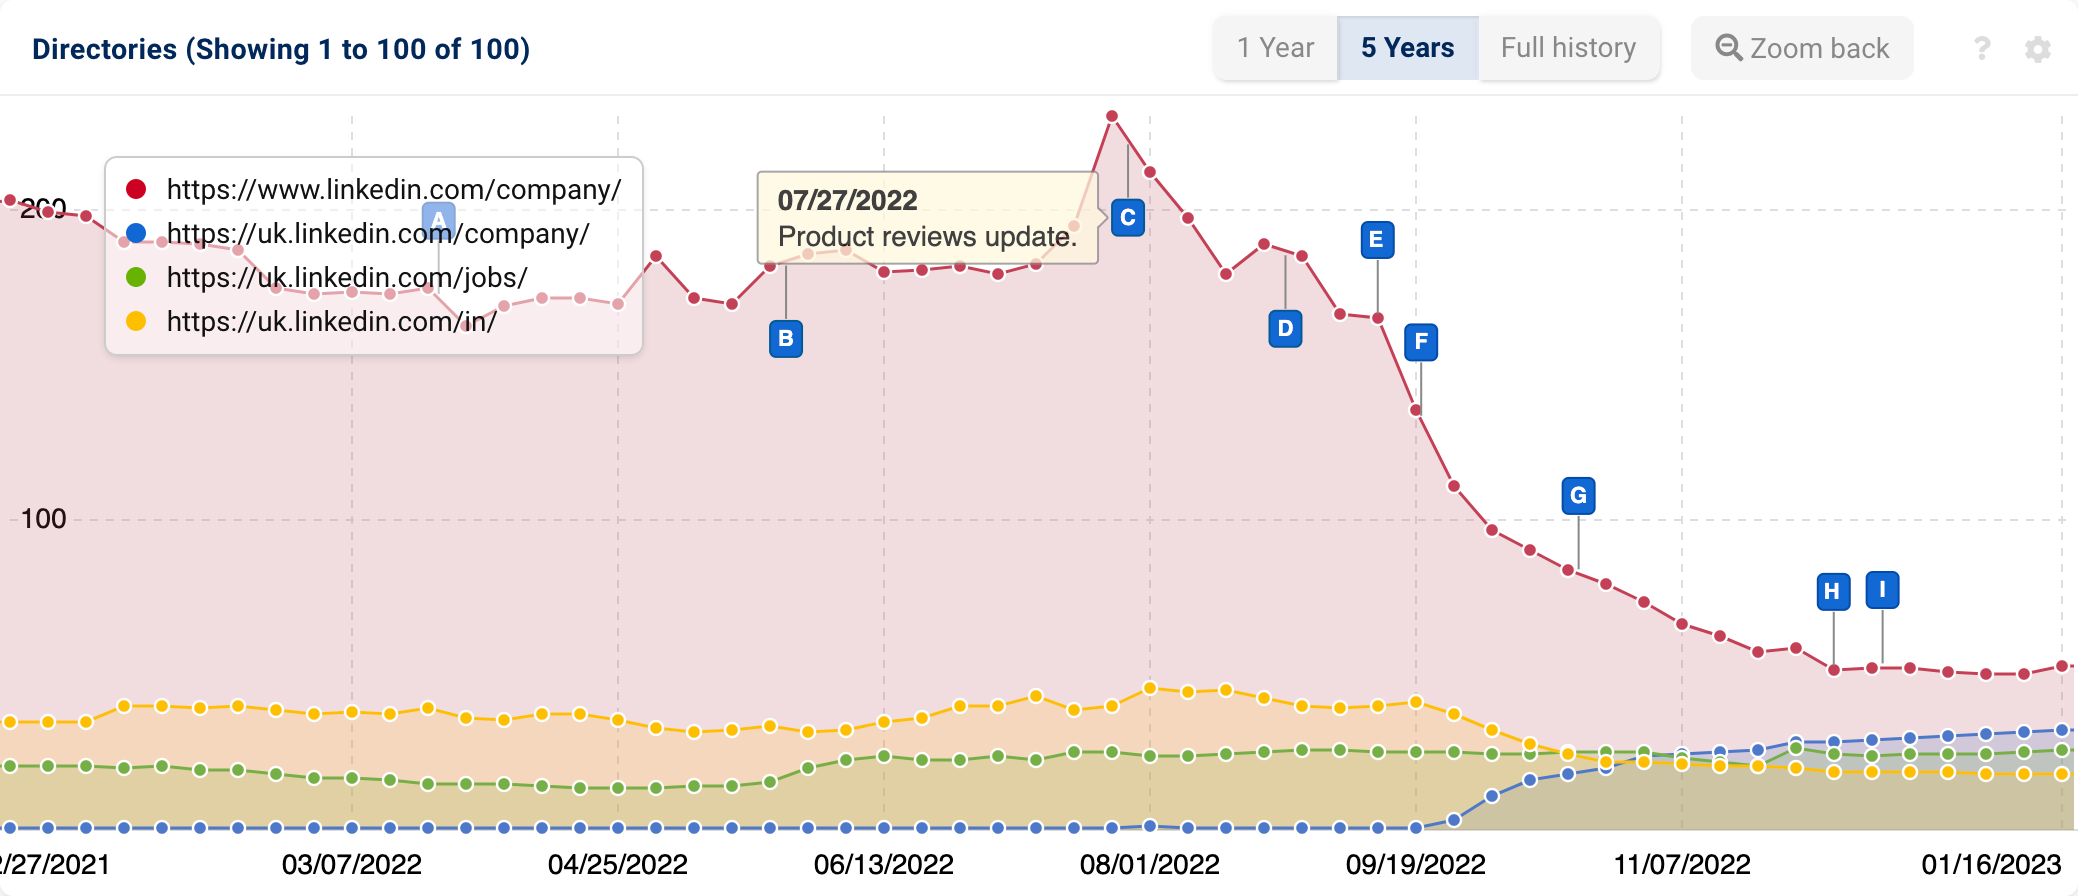
Our URL Change tool confirms that many company page rankings have changed from the root domain to the subdomain.
This supports that, in 2022, LinkedIn initiated a migration of company pages across the domains to maximise content relevance for UK users.
Whilst LinkedIn has managed to keep many keywords through the migration process, the subdomain has yet to catch up rankings-wise. To date, the UK-specific subdomain has not reached the visibility levels of the equivalent section on the root domain. As of the beginning of 2023, “/company” (root domain) is still ranking for in the region of 900K keywords. In comparison, “/company” (UK subdomain) is ranking for approx. 262.2K less terms.
The final outcome of a migration can take time to come to fruition. In time, we’d expect more of the UK company pages to replace the root domain ones on the UK search result pages. Whether that’ll be the case? We’ll have to wait and see.
Twitter.com’s Google SERP visibility also suffered somewhat (-128.5 VI points).

2022 was certainly an eventful year for the company. Elon Musk finalised the acquisition deal in October, there were major team restructures, and the platform itself underwent some interesting changes.
The subfolder which saw the most significant visibility drop was “/hashtag” which is part of the mobile subdomain (-61.2% YoY). The pages gather tweets that contain specific hashtags (e.g. #SEO).
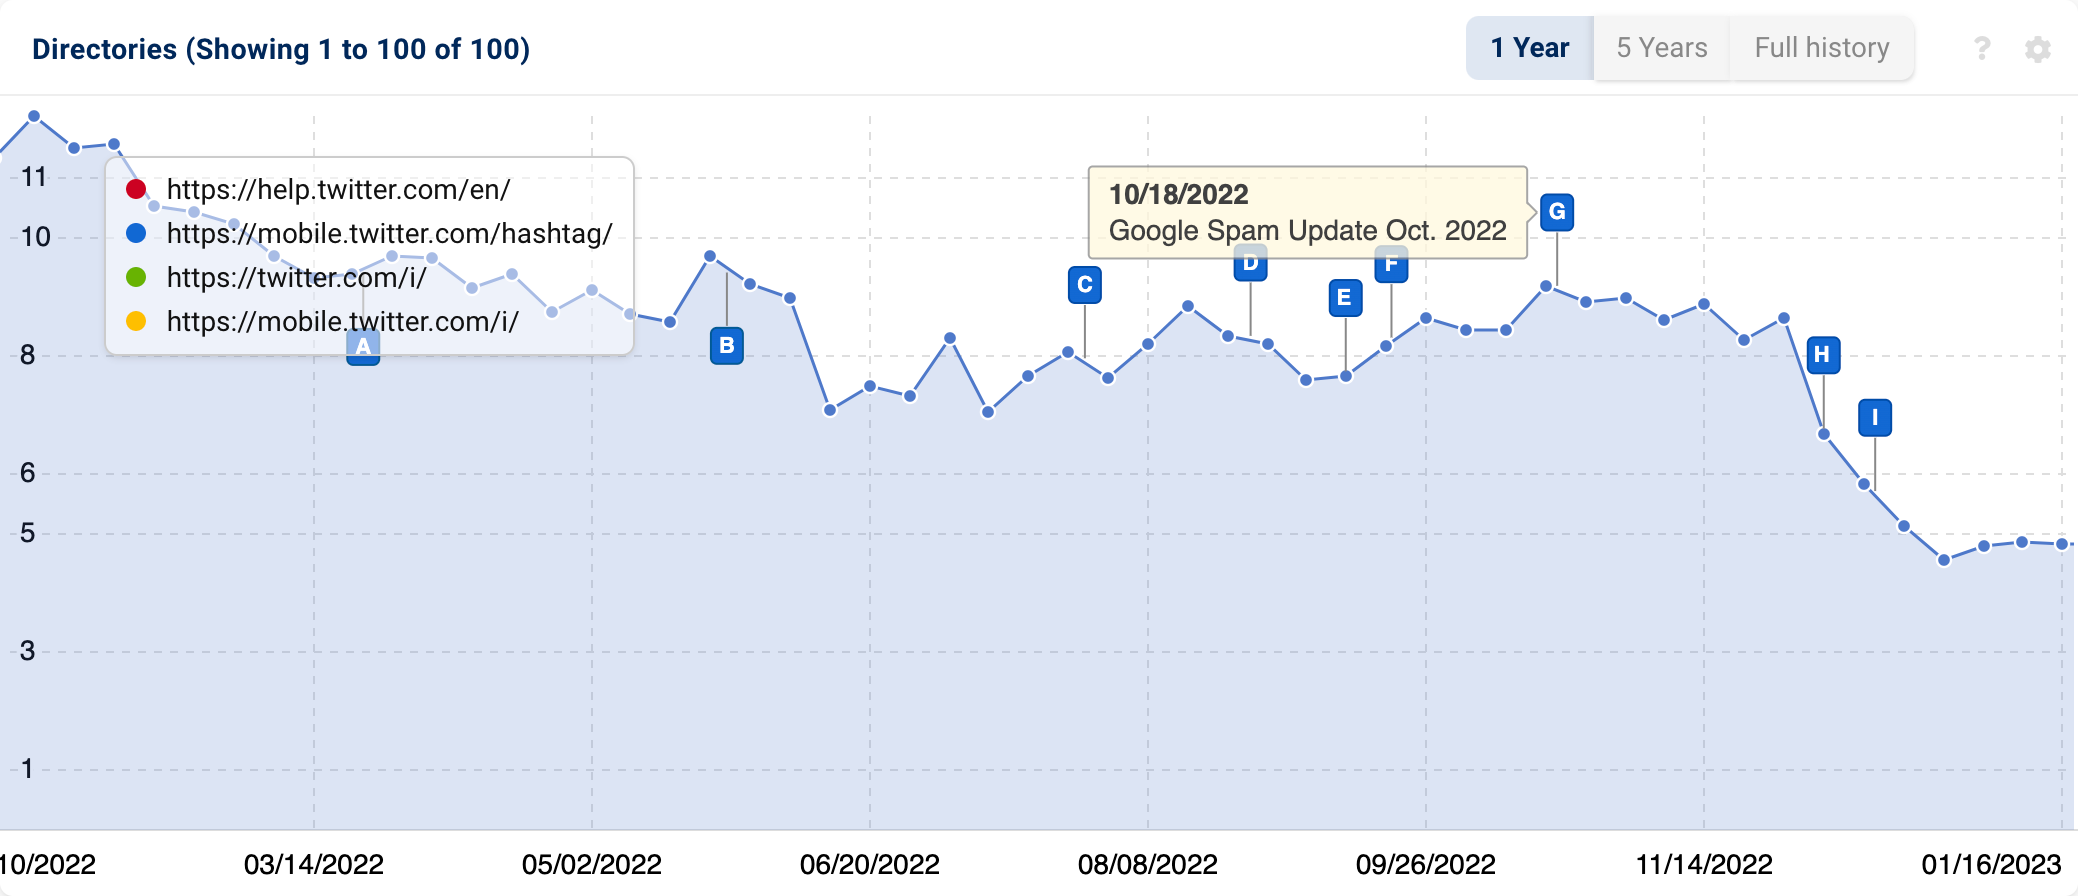
Despite this, searching for hashtags generates a URL appended with internal search parameters. Additionally, the links in “What’s Happening”, “Trending” etc. also direct users to these URLs. This begs the question, what purpose do the URLs within the “/hashtag” directory have?
This and few backlinks suggest the “/hashtag” pages are mainly for those who want to monitor content around specific topics. This could be for personal or professional purposes.
With these factors in mind, it is possible Google has decided these URLs aren’t beneficial to serve for popular short-tail keywords. As a result, many of these pages are disappearing from the SERPs.
Complete list of 2022 losers (absolute & percentage tables)
Below, we have included two tables containing the top 25 domains (absolute and percent). These have been filtered to remove adult content.
Absolute increases:
| # | Domain | 03.01.2022 | 02.01.2023 | Change |
|---|---|---|---|---|
| 1 | linkedin.com | 333.43 | 164.28 | -169.15 |
| 2 | twitter.com | 440.89 | 312.33 | -128.55 |
| 3 | theguardian.com | 351.13 | 226.00 | -125.13 |
| 4 | bbc.co.uk | 293.56 | 187.14 | -106.43 |
| 5 | gumtree.com | 121.90 | 60.30 | -61.60 |
| 6 | amazon.com | 197.64 | 142.76 | -54.88 |
| 7 | thefreedictionary.com | 217.73 | 165.39 | -52.34 |
| 8 | definitions.net | 70.13 | 21.97 | -48.15 |
| 9 | tvtropes.org | 121.30 | 73.22 | -48.08 |
| 10 | yourdictionary.com | 83.65 | 37.18 | -46.47 |
| 11 | rollingstone.com | 71.62 | 26.37 | -45.25 |
| 12 | biography.com | 69.87 | 25.96 | -43.91 |
| 13 | thesun.co.uk | 85.38 | 44.62 | -40.76 |
| 14 | quora.com | 123.34 | 87.23 | -36.12 |
| 15 | nytimes.com | 100.66 | 66.13 | -34.53 |
| 16 | rottentomatoes.com | 284.86 | 250.65 | -34.21 |
| 17 | dailymail.co.uk | 107.01 | 77.59 | -29.42 |
| 18 | dictionary.com | 467.51 | 439.35 | -28.16 |
| 19 | songfacts.com | 91.79 | 68.55 | -23.24 |
| 20 | reddit.com | 153.48 | 130.86 | -22.61 |
| 21 | thesaurus.com | 271.57 | 249.03 | -22.54 |
| 22 | vox.com | 29.08 | 7.99 | -21.08 |
| 23 | collinsdictionary.com | 505.76 | 485.28 | -20.48 |
| 24 | techradar.com | 73.93 | 54.18 | -19.75 |
| 25 | netflix.com | 92.28 | 74.02 | -18.25 |
| 26 | theverge.com | 27.91 | 10.23 | -17.68 |
| 27 | independent.co.uk | 152.41 | 134.86 | -17.56 |
| 28 | autocar.co.uk | 28.00 | 10.79 | -17.20 |
| 29 | cnn.com | 49.43 | 33.68 | -15.75 |
| 30 | lumenlearning.com | 21.73 | 7.02 | -14.71 |
| 31 | variety.com | 23.79 | 9.09 | -14.69 |
| 32 | medicinenet.com | 23.91 | 9.45 | -14.46 |
| 33 | vulture.com | 22.26 | 8.38 | -13.88 |
| 34 | commonsensemedia.org | 33.38 | 19.71 | -13.67 |
| 35 | livescience.com | 40.03 | 26.86 | -13.17 |
| 36 | theatlantic.com | 23.76 | 10.86 | -12.89 |
| 37 | express.co.uk | 34.11 | 21.31 | -12.80 |
| 38 | lovetoknow.com | 22.83 | 10.06 | -12.77 |
| 39 | songmeanings.com | 52.17 | 39.44 | -12.74 |
| 40 | bloomberg.com | 47.22 | 34.56 | -12.66 |
| 41 | sciencedirect.com | 191.67 | 179.34 | -12.33 |
| 42 | metro.co.uk | 40.97 | 28.64 | -12.32 |
| 43 | shopstyle.co.uk | 24.14 | 11.87 | -12.27 |
| 44 | goodhousekeeping.com | 126.22 | 114.01 | -12.21 |
| 45 | twitch.tv | 21.09 | 9.33 | -11.76 |
| 46 | lionshome.co.uk | 19.21 | 8.07 | -11.14 |
| 47 | rogerebert.com | 28.66 | 17.60 | -11.06 |
| 48 | dunelm.com | 88.91 | 78.15 | -10.76 |
| 49 | superdrug.com | 39.22 | 28.88 | -10.33 |
| 50 | duolingo.com | 14.74 | 4.94 | -9.80 |
| 51 | kerrang.com | 14.45 | 4.97 | -9.49 |
| 52 | mentalfloss.com | 14.73 | 5.31 | -9.42 |
| 53 | ndtv.com | 18.11 | 8.71 | -9.40 |
| 54 | alibaba.com | 18.85 | 9.47 | -9.37 |
| 55 | screenrant.com | 25.88 | 16.82 | -9.06 |
| 56 | ultimate-guitar.com | 37.08 | 28.12 | -8.96 |
| 57 | walmart.com | 32.77 | 23.99 | -8.79 |
| 58 | inews.co.uk | 14.41 | 5.77 | -8.64 |
| 59 | hollywoodreporter.com | 14.26 | 5.70 | -8.56 |
| 60 | nme.com | 31.25 | 22.89 | -8.36 |
| 61 | macmillandictionary.com | 87.86 | 79.60 | -8.26 |
| 62 | wikitravel.org | 15.74 | 7.80 | -7.93 |
| 63 | npr.org | 28.80 | 20.92 | -7.88 |
| 64 | homedepot.com | 18.40 | 10.75 | -7.65 |
| 65 | aljazeera.com | 18.46 | 10.91 | -7.55 |
| 66 | vanityfair.com | 11.39 | 3.86 | -7.53 |
| 67 | pitchfork.com | 28.37 | 20.92 | -7.45 |
| 68 | theconversation.com | 17.81 | 10.43 | -7.38 |
| 69 | spellchecker.net | 15.74 | 8.43 | -7.31 |
| 70 | dnb.com | 11.19 | 3.88 | -7.31 |
| 71 | ew.com | 15.73 | 8.42 | -7.30 |
| 72 | nintendo.com | 12.62 | 5.33 | -7.29 |
| 73 | france24.com | 10.41 | 3.42 | -6.99 |
| 74 | esquire.com | 21.41 | 14.43 | -6.98 |
| 75 | washingtonpost.com | 19.50 | 12.56 | -6.93 |
| 76 | nbcnews.com | 17.42 | 10.53 | -6.90 |
| 77 | usatoday.com | 19.68 | 12.81 | -6.87 |
| 78 | overstock.com | 12.37 | 5.59 | -6.79 |
| 79 | howtogeek.com | 18.51 | 11.74 | -6.77 |
| 80 | deadline.com | 10.53 | 3.83 | -6.70 |
| 81 | knowyourmeme.com | 19.83 | 13.15 | -6.68 |
| 82 | verywellhealth.com | 42.22 | 35.61 | -6.61 |
| 83 | thetrendspotter.net | 12.52 | 6.10 | -6.42 |
| 84 | cnet.com | 48.66 | 42.36 | -6.31 |
| 85 | pcgamer.com | 13.69 | 7.41 | -6.28 |
| 86 | encyclopedia.com | 21.13 | 14.85 | -6.27 |
| 87 | ranker.com | 17.53 | 11.26 | -6.27 |
| 88 | pnas.org | 10.71 | 4.47 | -6.24 |
| 89 | indiatimes.com | 13.67 | 7.61 | -6.06 |
| 90 | reuters.com | 22.40 | 16.37 | -6.04 |
| 91 | polygon.com | 11.20 | 5.20 | -6.01 |
| 92 | songlyrics.com | 15.26 | 9.26 | -6.01 |
| 93 | theaa.com | 47.15 | 41.22 | -5.93 |
| 94 | target.com | 18.47 | 12.57 | -5.90 |
| 95 | usnews.com | 27.37 | 21.50 | -5.87 |
| 96 | ao.com | 34.32 | 28.46 | -5.86 |
| 97 | familydoctor.org | 13.06 | 7.20 | -5.86 |
| 98 | latimes.com | 12.74 | 6.89 | -5.85 |
| 99 | stackexchange.com | 31.19 | 25.37 | -5.82 |
| 100 | reverso.net | 29.56 | 23.86 | -5.70 |
| 101 | glamour.com | 20.14 | 14.44 | -5.69 |
Percentage increases:
| # | Domain | 03.01.2022 | 02.01.2023 | Change |
|---|---|---|---|---|
| 1 | vox.com | 29.08 | 7.99 | -72.52% |
| 2 | definitions.net | 70.13 | 21.97 | -68.67% |
| 3 | lumenlearning.com | 21.73 | 7.02 | -67.69% |
| 4 | france24.com | 10.41 | 3.42 | -67.15% |
| 5 | duolingo.com | 14.74 | 4.94 | -66.50% |
| 6 | vanityfair.com | 11.39 | 3.86 | -66.13% |
| 7 | kerrang.com | 14.45 | 4.97 | -65.64% |
| 8 | dnb.com | 11.19 | 3.88 | -65.31% |
| 9 | mentalfloss.com | 14.73 | 5.31 | -63.97% |
| 10 | deadline.com | 10.53 | 3.83 | -63.65% |
| 11 | theverge.com | 27.91 | 10.23 | -63.36% |
| 12 | rollingstone.com | 71.62 | 26.37 | -63.18% |
| 13 | biography.com | 69.87 | 25.96 | -62.85% |
| 14 | vulture.com | 22.26 | 8.38 | -62.34% |
| 15 | variety.com | 23.79 | 9.09 | -61.77% |
| 16 | autocar.co.uk | 28.00 | 10.79 | -61.45% |
| 17 | medicinenet.com | 23.91 | 9.45 | -60.47% |
| 18 | hollywoodreporter.com | 14.26 | 5.70 | -60.02% |
| 19 | inews.co.uk | 14.41 | 5.77 | -59.93% |
| 20 | indiewire.com | 8.59 | 3.46 | -59.74% |
| 21 | pnas.org | 10.71 | 4.47 | -58.26% |
| 22 | lionshome.co.uk | 19.21 | 8.07 | -58.00% |
| 23 | nintendo.com | 12.62 | 5.33 | -57.76% |
| 24 | missguided.co.uk | 9.82 | 4.17 | -57.57% |
| 25 | indianexpress.com | 8.08 | 3.51 | -56.54% |
| 26 | thefamouspeople.com | 8.34 | 3.65 | -56.31% |
| 27 | lovetoknow.com | 22.83 | 10.06 | -55.93% |
| 28 | twitch.tv | 21.09 | 9.33 | -55.77% |
| 29 | yourdictionary.com | 83.65 | 37.18 | -55.55% |
| 30 | overstock.com | 12.37 | 5.59 | -54.84% |
| 31 | theatlantic.com | 23.76 | 10.86 | -54.27% |
| 32 | polygon.com | 11.20 | 5.20 | -53.63% |
| 33 | techwalla.com | 9.40 | 4.37 | -53.54% |
| 34 | loudwire.com | 6.72 | 3.13 | -53.41% |
| 35 | historyextra.com | 7.73 | 3.61 | -53.29% |
| 36 | nordstrom.com | 6.46 | 3.03 | -53.06% |
| 37 | inc.com | 6.85 | 3.30 | -51.90% |
| 38 | ndtv.com | 18.11 | 8.71 | -51.90% |
| 39 | wordplays.com | 10.18 | 4.94 | -51.53% |
| 40 | thetrendspotter.net | 12.52 | 6.10 | -51.28% |
| 41 | elsevier.com | 10.80 | 5.29 | -50.98% |
| 42 | shopstyle.co.uk | 24.14 | 11.87 | -50.83% |
| 43 | linkedin.com | 333.43 | 164.28 | -50.73% |
| 44 | gumtree.com | 121.90 | 60.30 | -50.53% |
| 45 | wikitravel.org | 15.74 | 7.80 | -50.42% |
| 46 | economist.com | 8.22 | 4.09 | -50.24% |
| 47 | alibaba.com | 18.85 | 9.47 | -49.73% |
| 48 | techcrunch.com | 10.17 | 5.13 | -49.55% |
| 49 | hindustantimes.com | 9.12 | 4.64 | -49.10% |
| 50 | roman.co.uk | 6.76 | 3.53 | -47.78% |
| 51 | thesun.co.uk | 85.38 | 44.62 | -47.74% |
| 52 | celebritynetworth.com | 6.55 | 3.43 | -47.69% |
| 53 | bustle.com | 10.46 | 5.50 | -47.43% |
| 54 | thecut.com | 8.47 | 4.49 | -46.97% |
| 55 | scarymommy.com | 5.96 | 3.18 | -46.65% |
| 56 | spellchecker.net | 15.74 | 8.43 | -46.45% |
| 57 | ew.com | 15.73 | 8.42 | -46.44% |
| 58 | abc.com | 6.16 | 3.31 | -46.23% |
| 59 | latimes.com | 12.74 | 6.89 | -45.92% |
| 60 | pcgamer.com | 13.69 | 7.41 | -45.89% |
| 61 | simonandschuster.co.uk | 5.78 | 3.13 | -45.88% |
| 62 | blackwells.co.uk | 12.26 | 6.75 | -44.92% |
| 63 | familydoctor.org | 13.06 | 7.20 | -44.85% |
| 64 | indiatimes.com | 13.67 | 7.61 | -44.34% |
| 65 | slate.com | 7.00 | 3.91 | -44.17% |
| 66 | ludwig.guru | 11.31 | 6.34 | -43.94% |
| 67 | dummies.com | 6.70 | 3.81 | -43.14% |
| 68 | loudersound.com | 12.75 | 7.26 | -43.05% |
| 69 | gettyimages.com | 9.40 | 5.35 | -43.03% |
| 70 | sonypictures.com | 5.26 | 3.01 | -42.85% |
| 71 | techadvisor.com | 7.84 | 4.48 | -42.81% |
| 72 | iheart.com | 6.04 | 3.46 | -42.65% |
| 73 | homedepot.com | 18.40 | 10.75 | -41.58% |
| 74 | theconversation.com | 17.81 | 10.43 | -41.44% |
| 75 | commonsensemedia.org | 33.38 | 19.71 | -40.96% |
| 76 | aljazeera.com | 18.46 | 10.91 | -40.89% |
| 77 | lovethesales.com | 6.33 | 3.76 | -40.63% |
| 78 | jobsite.co.uk | 8.09 | 4.81 | -40.58% |
| 79 | bestreviews.guide | 12.43 | 7.40 | -40.46% |
| 80 | freemake.com | 5.10 | 3.05 | -40.17% |
| 81 | plos.org | 5.26 | 3.16 | -39.80% |
| 82 | tvtropes.org | 121.30 | 73.22 | -39.64% |
| 83 | nbcnews.com | 17.42 | 10.53 | -39.58% |
| 84 | songlyrics.com | 15.26 | 9.26 | -39.35% |
| 85 | goodto.com | 9.76 | 5.92 | -39.35% |
| 86 | motor1.com | 5.95 | 3.64 | -38.80% |
| 87 | abc.net.au | 7.21 | 4.42 | -38.71% |
| 88 | nypost.com | 11.18 | 6.86 | -38.63% |
| 89 | rogerebert.com | 28.66 | 17.60 | -38.60% |
| 90 | careerexplorer.com | 4.93 | 3.04 | -38.33% |
| 91 | juno.co.uk | 4.89 | 3.01 | -38.33% |
| 92 | gaana.com | 6.25 | 3.86 | -38.26% |
| 93 | huffpost.com | 8.78 | 5.43 | -38.12% |
| 94 | macmillanthesaurus.com | 5.85 | 3.63 | -37.89% |
| 95 | primelocation.com | 5.40 | 3.37 | -37.62% |
| 96 | express.co.uk | 34.11 | 21.31 | -37.52% |
| 97 | kiddle.co | 7.72 | 4.83 | -37.47% |
| 98 | nymag.com | 13.92 | 8.75 | -37.14% |
| 99 | t3.com | 8.44 | 5.31 | -37.07% |
| 100 | howtogeek.com | 18.51 | 11.74 | -36.56% |
Conclusion
SEO is an ever-changing industry, and 2022’s algorithms have caused a lot of SERP volatility. But what can we take away from the websites that’ve been unfortunate this year?
- Brands are either sticking with or ditching AMP, but sticking with it does not necessarily mean that those pages will perform well. As we’ve seen through this analysis, in some instances, AMP pages have lost out on rankings to their non-AMP versions on mobile.
- High quantities of intrusive ads can affect a website’s ranking potential. Ads are an important revenue stream for many sites, however, their placement should be well considered to minimise the impact on overall UX.
- Assessing the trustworthiness of content can be challenging when it is a mix of fact and opinion. Referencing relevant and authoritative sources within this content, where possible, is worthwhile.
- Website redesigns and restructures shouldn’t be taken lightly. Sometimes what seems like an SEO improvement isn’t one in reality. This is why A/B testing is essential before making significant changes.
- Culling content is always risky, and should only be actioned where justified by data. It is also important to remember to, where relevant, direct users to alternative content that is helpful based on their wants and needs.
- Short-tail and brand keyword rankings often experience major position shifts. The top ranking results for these terms change frequently. Where URLs target these terms on a large scale, it opens up the possibility of significant visibility losses.


