2022 was yet another volatile year in Google’s search results, with the announcement of the new Helpful Content system, updates to other ranking systems, major algorithm updates rolling out concurrently, and significant volatility caused by external factors, such as the global economy. This issue of IndexWatch analyses the winning domains in Google Search US.
- Methodology
- Government sites and authoritative health institutions
- Celebrity and entertainment websites
- Large eCommerce players
- Dictionary sites
- Product Review Sites
- Music Sites
- Forbes’ Big Year
- The Athletic
- Bankrate & Other Finance Sites
- Social Media Sites & Inventory growth
- Conclusion
- Other IndexWatch studies include UK, DE, ES, IT and FR
It’s important to remember that implementing an SEO strategy is just one of many factors that can contribute to whether a site gains or loses visibility as the result of an algorithm update. In fact, some sites may not focus on SEO at all, and can still be significantly impacted, either positively or negatively.
There are other algorithms at play that also affect how websites fare with organic visibility. Google formally labeled many of these “ranking systems” in November 2022, which include systems aimed at addressing spam, promoting original content, mitigating misinformation and more. Factors such as “QDF” – or “query deserves freshness” – can also impact how a site ranks during a given period.
While many visibility changes can be tied to specific SEO efforts, others may be impacted by the above ranking systems or other external factors. Additionally, Google consistently improves in its ability to understand the intent behind queries, which can also cause significant changes in how sites rank.
Methodology
We have identified the 200 domains with the strongest growth in 2022 – both in percentage and in absolute terms using the SISTRIX Visibility Index, which indicates a value for how visible a domain is in Google’s search results.
By actively measuring the rankings across a representative keyword set, the SISTRIX data is free from external influences such as seasonality, the weather, vacation times and other external factors and trends.
The data shown below is collected from mobile search rankings only. The first table shows the top 100 domain winners by absolute VI gain in Google US.
| # | Domain | 03.01.2022 | 02.01.2023 | Change |
|---|---|---|---|---|
| 1 | youtube.com | 590.12 | 1965.28 | 1375.16 |
| 2 | wikipedia.org | 4859.40 | 6028.93 | 1169.53 |
| 3 | amazon.com | 2458.37 | 3322.49 | 864.13 |
| 4 | wiktionary.org | 338.69 | 680.01 | 341.33 |
| 5 | google.com | 461.35 | 707.04 | 245.70 |
| 6 | ebay.com | 454.69 | 684.93 | 230.23 |
| 7 | imdb.com | 685.17 | 915.04 | 229.86 |
| 8 | cambridge.org | 397.29 | 564.38 | 167.09 |
| 9 | walmart.com | 665.49 | 826.32 | 160.84 |
| 10 | tripadvisor.com | 336.75 | 482.63 | 145.87 |
| 11 | microsoft.com | 317.50 | 461.37 | 143.87 |
| 12 | etsy.com | 265.14 | 375.96 | 110.81 |
| 13 | instagram.com | 498.16 | 608.04 | 109.88 |
| 14 | pinterest.com | 327.61 | 431.52 | 103.91 |
| 15 | facebook.com | 897.11 | 1000.70 | 103.59 |
| 16 | nih.gov | 153.49 | 254.57 | 101.08 |
| 17 | mayoclinic.org | 194.04 | 290.27 | 96.22 |
| 18 | indeed.com | 157.73 | 239.52 | 81.80 |
| 19 | clevelandclinic.org | 73.58 | 154.12 | 80.54 |
| 20 | spotify.com | 167.28 | 246.39 | 79.11 |
| 21 | forbes.com | 99.49 | 174.02 | 74.53 |
| 22 | genius.com | 189.70 | 251.75 | 62.05 |
| 23 | cdc.gov | 122.08 | 183.48 | 61.40 |
| 24 | nytimes.com | 233.03 | 293.98 | 60.95 |
| 25 | homedepot.com | 366.14 | 426.98 | 60.84 |
| 26 | apple.com | 141.22 | 193.27 | 52.05 |
| 27 | bestbuy.com | 484.33 | 534.54 | 50.21 |
| 28 | mapquest.com | 41.19 | 90.59 | 49.40 |
| 29 | collinsdictionary.com | 256.69 | 305.73 | 49.03 |
| 30 | target.com | 412.65 | 460.62 | 47.97 |
| 31 | adobe.com | 71.19 | 117.97 | 46.78 |
| 32 | yahoo.com | 100.04 | 143.92 | 43.89 |
| 33 | booking.com | 139.38 | 180.67 | 41.28 |
| 34 | collider.com | 6.40 | 44.01 | 37.62 |
| 35 | www.nhs.uk | 40.05 | 76.72 | 36.67 |
| 36 | hubspot.com | 26.98 | 63.17 | 36.20 |
| 37 | thespruce.com | 45.66 | 81.48 | 35.82 |
| 38 | wikivoyage.org | 9.12 | 44.04 | 34.92 |
| 39 | nature.com | 25.58 | 60.20 | 34.63 |
| 40 | wikihow.com | 42.04 | 74.78 | 32.74 |
| 41 | last.fm | 16.41 | 48.71 | 32.29 |
| 42 | lawinsider.com | 24.67 | 55.66 | 31.00 |
| 43 | travelandleisure.com | 32.78 | 63.12 | 30.33 |
| 44 | irs.gov | 54.61 | 84.45 | 29.84 |
| 45 | bhphotovideo.com | 110.11 | 138.68 | 28.57 |
| 46 | hopkinsmedicine.org | 43.58 | 71.83 | 28.25 |
| 47 | tiktok.com | 13.68 | 41.11 | 27.43 |
| 48 | rd.com | 17.64 | 44.76 | 27.12 |
| 49 | xxx | 44.57 | 70.76 | 26.19 |
| 50 | vogue.com | 23.66 | 49.81 | 26.15 |
| 51 | ign.com | 46.86 | 71.75 | 24.89 |
| 52 | espn.com | 80.08 | 104.65 | 24.56 |
| 53 | britannica.com | 610.56 | 635.06 | 24.50 |
| 54 | techtarget.com | 56.75 | 81.21 | 24.46 |
| 55 | fandom.com | 378.00 | 402.03 | 24.04 |
| 56 | lowes.com | 161.74 | 185.73 | 24.00 |
| 57 | niche.com | 37.10 | 60.86 | 23.76 |
| 58 | nymag.com | 51.83 | 75.56 | 23.74 |
| 59 | bedbathandbeyond.com | 67.15 | 90.62 | 23.47 |
| 60 | washingtonpost.com | 43.14 | 66.43 | 23.28 |
| 61 | nerdwallet.com | 83.05 | 106.13 | 23.08 |
| 62 | makeuseof.com | 39.33 | 62.31 | 22.98 |
| 63 | medlineplus.gov | 98.86 | 121.49 | 22.63 |
| 64 | pixabay.com | 37.51 | 59.90 | 22.40 |
| 65 | redfin.com | 36.72 | 58.74 | 22.02 |
| 66 | remax.com | 17.87 | 39.87 | 22.00 |
| 67 | npr.org | 53.63 | 75.53 | 21.90 |
| 68 | nationalgeographic.org | 16.25 | 38.14 | 21.89 |
| 69 | architecturaldigest.com | 11.36 | 33.07 | 21.71 |
| 70 | healthline.com | 176.09 | 197.74 | 21.65 |
| 71 | cancer.gov | 29.63 | 51.21 | 21.59 |
| 72 | shopify.com | 16.51 | 37.37 | 20.86 |
| 73 | theathletic.com | 6.29 | 27.04 | 20.75 |
| 74 | rtings.com | 22.05 | 42.63 | 20.58 |
| 75 | harvard.edu | 54.45 | 74.87 | 20.41 |
| 76 | movieweb.com | 1.64 | 22.00 | 20.36 |
| 77 | softwaretestinghelp.com | 12.17 | 32.24 | 20.07 |
| 78 | foodnetwork.com | 42.79 | 62.70 | 19.92 |
| 79 | congress.gov | 12.75 | 32.44 | 19.70 |
| 80 | mountsinai.org | 11.45 | 30.92 | 19.47 |
| 81 | archive.org | 8.04 | 26.77 | 18.73 |
| 82 | wired.com | 20.89 | 39.35 | 18.46 |
| 83 | weather.com | 16.06 | 34.16 | 18.09 |
| 84 | nationalgeographic.com | 37.80 | 55.83 | 18.04 |
| 85 | freepik.com | 7.15 | 25.01 | 17.86 |
| 86 | hbr.org | 23.96 | 41.72 | 17.76 |
| 87 | delish.com | 20.39 | 38.15 | 17.75 |
| 88 | hotels.com | 155.61 | 173.35 | 17.74 |
| 89 | byjus.com | 5.59 | 23.30 | 17.71 |
| 90 | zillow.com | 140.40 | 157.96 | 17.56 |
| 91 | people.com | 34.00 | 51.15 | 17.15 |
| 92 | azlyrics.com | 89.05 | 106.05 | 17.01 |
| 93 | thepioneerwoman.com | 11.47 | 28.36 | 16.89 |
| 94 | tasteofhome.com | 27.99 | 44.37 | 16.38 |
| 95 | xxx | 45.05 | 61.42 | 16.37 |
| 96 | geeksforgeeks.org | 29.37 | 45.72 | 16.35 |
| 97 | akc.org | 33.95 | 50.22 | 16.27 |
| 98 | timeout.com | 26.39 | 42.57 | 16.17 |
| 99 | poshmark.com | 18.52 | 34.55 | 16.03 |
| 100 | gamerant.com | 12.05 | 27.96 | 15.91 |
Here are the Top 100 winners by percentage in Google US
| # | Domain | 03.01.2022 | 02.01.2023 | Change |
|---|---|---|---|---|
| 1 | movieweb.com | 1.64 | 22.00 | 1242.78% |
| 2 | faroutmagazine.co.uk | 1.59 | 17.47 | 995.96% |
| 3 | collider.com | 6.40 | 44.01 | 588.03% |
| 4 | betterup.com | 1.54 | 9.92 | 546.05% |
| 5 | flightstats.com | 1.44 | 8.91 | 519.66% |
| 6 | stylecraze.com | 1.69 | 10.22 | 503.67% |
| 7 | themoviedb.org | 2.89 | 16.95 | 485.87% |
| 8 | veed.io | 1.39 | 7.63 | 450.81% |
| 9 | cyberlink.com | 1.80 | 9.59 | 433.65% |
| 10 | theplanetd.com | 1.09 | 5.53 | 408.30% |
| 11 | simplilearn.com | 2.42 | 12.06 | 398.09% |
| 12 | prowritingaid.com | 1.11 | 5.51 | 396.73% |
| 13 | wikivoyage.org | 9.12 | 44.04 | 382.80% |
| 14 | utsa.edu | 1.06 | 5.08 | 380.94% |
| 15 | homedit.com | 1.44 | 6.76 | 370.58% |
| 16 | waze.com | 2.59 | 12.06 | 365.04% |
| 17 | carnegieendowment.org | 1.04 | 4.81 | 364.24% |
| 18 | security.org | 1.00 | 4.55 | 353.37% |
| 19 | cabletv.com | 1.24 | 5.61 | 351.48% |
| 20 | theathletic.com | 6.29 | 27.04 | 330.08% |
| 21 | byjus.com | 5.59 | 23.30 | 316.95% |
| 22 | teambuilding.com | 1.08 | 4.33 | 300.04% |
| 23 | twinkl.com | 1.67 | 6.61 | 296.25% |
| 24 | drugbank.com | 1.55 | 6.13 | 295.68% |
| 25 | thrillist.com | 4.70 | 18.45 | 292.58% |
| 26 | busytourist.com | 1.97 | 7.66 | 288.97% |
| 27 | handluggageonly.co.uk | 3.07 | 11.90 | 287.68% |
| 28 | jdpower.com | 3.75 | 14.53 | 287.67% |
| 29 | psychcentral.com | 1.61 | 6.22 | 285.16% |
| 30 | lendingtree.com | 5.49 | 21.09 | 284.50% |
| 31 | hostinger.com | 2.88 | 10.87 | 277.10% |
| 32 | monday.com | 1.63 | 5.98 | 267.59% |
| 33 | angi.com | 3.20 | 11.59 | 262.13% |
| 34 | nhsinform.scot | 5.35 | 18.79 | 251.16% |
| 35 | freepik.com | 7.15 | 25.01 | 249.63% |
| 36 | simpleflying.com | 1.17 | 4.04 | 245.86% |
| 37 | americansongwriter.com | 3.35 | 11.54 | 244.67% |
| 38 | wynk.in | 1.80 | 6.17 | 242.92% |
| 39 | fashionbeans.com | 1.95 | 6.56 | 236.69% |
| 40 | preply.com | 1.56 | 5.24 | 235.32% |
| 41 | muscleandstrength.com | 1.20 | 4.02 | 234.42% |
| 42 | xxx | 1.63 | 5.45 | 233.75% |
| 43 | archive.org | 8.04 | 26.77 | 233.08% |
| 44 | youtube.com | 590.12 | 1965.28 | 233.03% |
| 45 | scienceofpeople.com | 1.19 | 3.92 | 229.11% |
| 46 | csis.org | 1.65 | 5.43 | 228.97% |
| 47 | havecamerawilltravel.com | 1.04 | 3.44 | 228.96% |
| 48 | hackaday.com | 1.29 | 4.20 | 226.68% |
| 49 | thekrazycouponlady.com | 1.96 | 6.36 | 225.10% |
| 50 | smashingmagazine.com | 1.42 | 4.58 | 223.83% |
| 51 | hotcars.com | 3.82 | 12.35 | 223.49% |
| 52 | appliancesconnection.com | 1.13 | 3.64 | 223.48% |
| 53 | edweek.org | 2.32 | 7.40 | 218.50% |
| 54 | cbinsights.com | 1.32 | 4.19 | 216.37% |
| 55 | softlay.com | 1.24 | 3.91 | 214.56% |
| 56 | thegamer.com | 6.75 | 21.21 | 213.99% |
| 57 | pennmedicine.org | 6.11 | 19.02 | 211.43% |
| 58 | science.org | 4.25 | 13.18 | 209.86% |
| 59 | seekingalpha.com | 3.93 | 12.16 | 209.64% |
| 60 | goldderby.com | 1.03 | 3.13 | 203.42% |
| 61 | planetofhotels.com | 1.02 | 3.08 | 203.29% |
| 62 | earthtrekkers.com | 1.23 | 3.71 | 200.97% |
| 63 | tiktok.com | 13.68 | 41.11 | 200.57% |
| 64 | guitarspace.org | 1.07 | 3.21 | 199.87% |
| 65 | gao.gov | 1.28 | 3.83 | 199.33% |
| 66 | mckinsey.com | 7.82 | 23.35 | 198.75% |
| 67 | cbpp.org | 1.10 | 3.28 | 198.11% |
| 68 | substack.com | 1.52 | 4.51 | 197.59% |
| 69 | webbikeworld.com | 1.08 | 3.22 | 197.16% |
| 70 | last.fm | 16.41 | 48.71 | 196.73% |
| 71 | familydestinationsguide.com | 2.15 | 6.39 | 196.59% |
| 72 | wordunscrambler.net | 1.01 | 2.99 | 196.43% |
| 73 | petapixel.com | 2.46 | 7.28 | 196.31% |
| 74 | adp.com | 2.69 | 7.93 | 195.01% |
| 75 | publicschoolreview.com | 1.78 | 5.23 | 194.08% |
| 76 | onetonline.org | 1.86 | 5.46 | 193.21% |
| 77 | zenbusiness.com | 1.24 | 3.61 | 192.31% |
| 78 | a-z-animals.com | 5.21 | 15.22 | 192.28% |
| 79 | financesonline.com | 1.28 | 3.75 | 192.17% |
| 80 | architecturaldigest.com | 11.36 | 33.07 | 191.00% |
| 81 | hypebeast.com | 2.47 | 7.18 | 190.19% |
| 82 | pitchbook.com | 2.48 | 7.18 | 189.05% |
| 83 | investing.com | 1.93 | 5.53 | 186.77% |
| 84 | imtranslator.net | 1.22 | 3.48 | 185.34% |
| 85 | constantcontact.com | 1.48 | 4.20 | 183.18% |
| 86 | pacsun.com | 2.29 | 6.48 | 183.03% |
| 87 | tidal.com | 1.56 | 4.39 | 181.39% |
| 88 | electronicshub.org | 1.42 | 3.99 | 180.27% |
| 89 | mometrix.com | 1.58 | 4.41 | 179.46% |
| 90 | dailymotion.com | 7.07 | 19.73 | 179.20% |
| 91 | insidehighered.com | 1.73 | 4.83 | 178.63% |
| 92 | getapp.com | 1.69 | 4.71 | 178.63% |
| 93 | 411.com | 1.06 | 2.94 | 178.22% |
| 94 | progressive.com | 6.11 | 16.93 | 177.04% |
| 95 | studiobinder.com | 2.54 | 7.03 | 176.69% |
| 96 | realsimple.com | 5.88 | 16.11 | 174.17% |
| 97 | stellarinfo.com | 1.54 | 4.23 | 174.04% |
| 98 | pods.com | 1.43 | 3.91 | 173.45% |
| 99 | nomadicmatt.com | 6.26 | 17.08 | 172.92% |
| 100 | guitarplayer.com | 1.02 | 2.77 | 172.52% |
| 101 | franklin.edu | 1.02 | 2.78 | 172.44% |
Government sites and authoritative health institutions
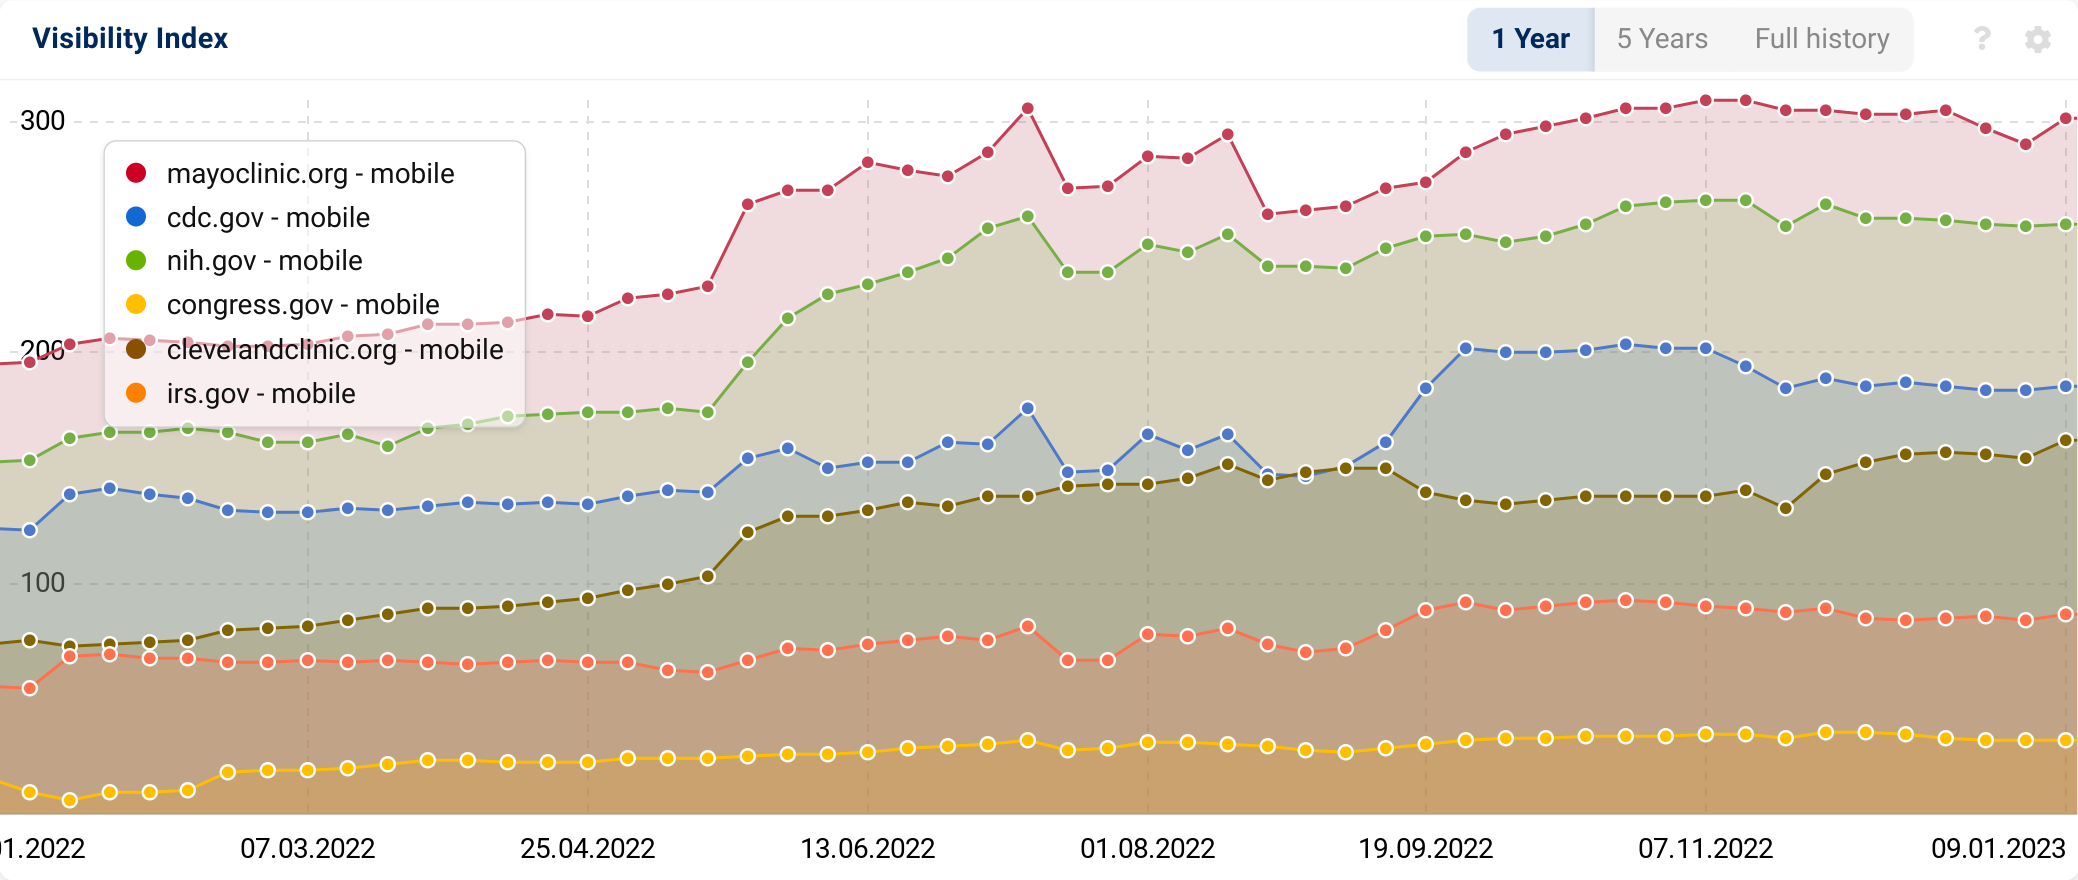
As with the past few years, government websites and other highly authoritative institutions are among the top winners in 2022.
- mayoclinic.org (+96.22)
- cdc.gov (+61.4)
- nih.gov (+101.08)
- congress.gov (+19.7)
- clevelandclinic.org (+80.54)
- www.nhs.uk (+36.67)
- irs.gov (+29.84)
While many health sites have struggled to gain SEO visibility in recent years, these trusted authorities tend to only gain visibility over time, with spikes often taking place around core updates or other dates when the sites seemingly move as a group. This may be due to Google’s crisis information systems it uses in rankings, or how Google “designed [their] systems to prefer authority over factors like recency or exact word matches while a crisis is developing” (source).
Celebrity and entertainment websites
A variety of the top visibility winners of 2022 were publisher sites focused on celebrities, TV shows, movies and entertainment. Below are a few example of what these wins looked like in terms of ranking on Google:
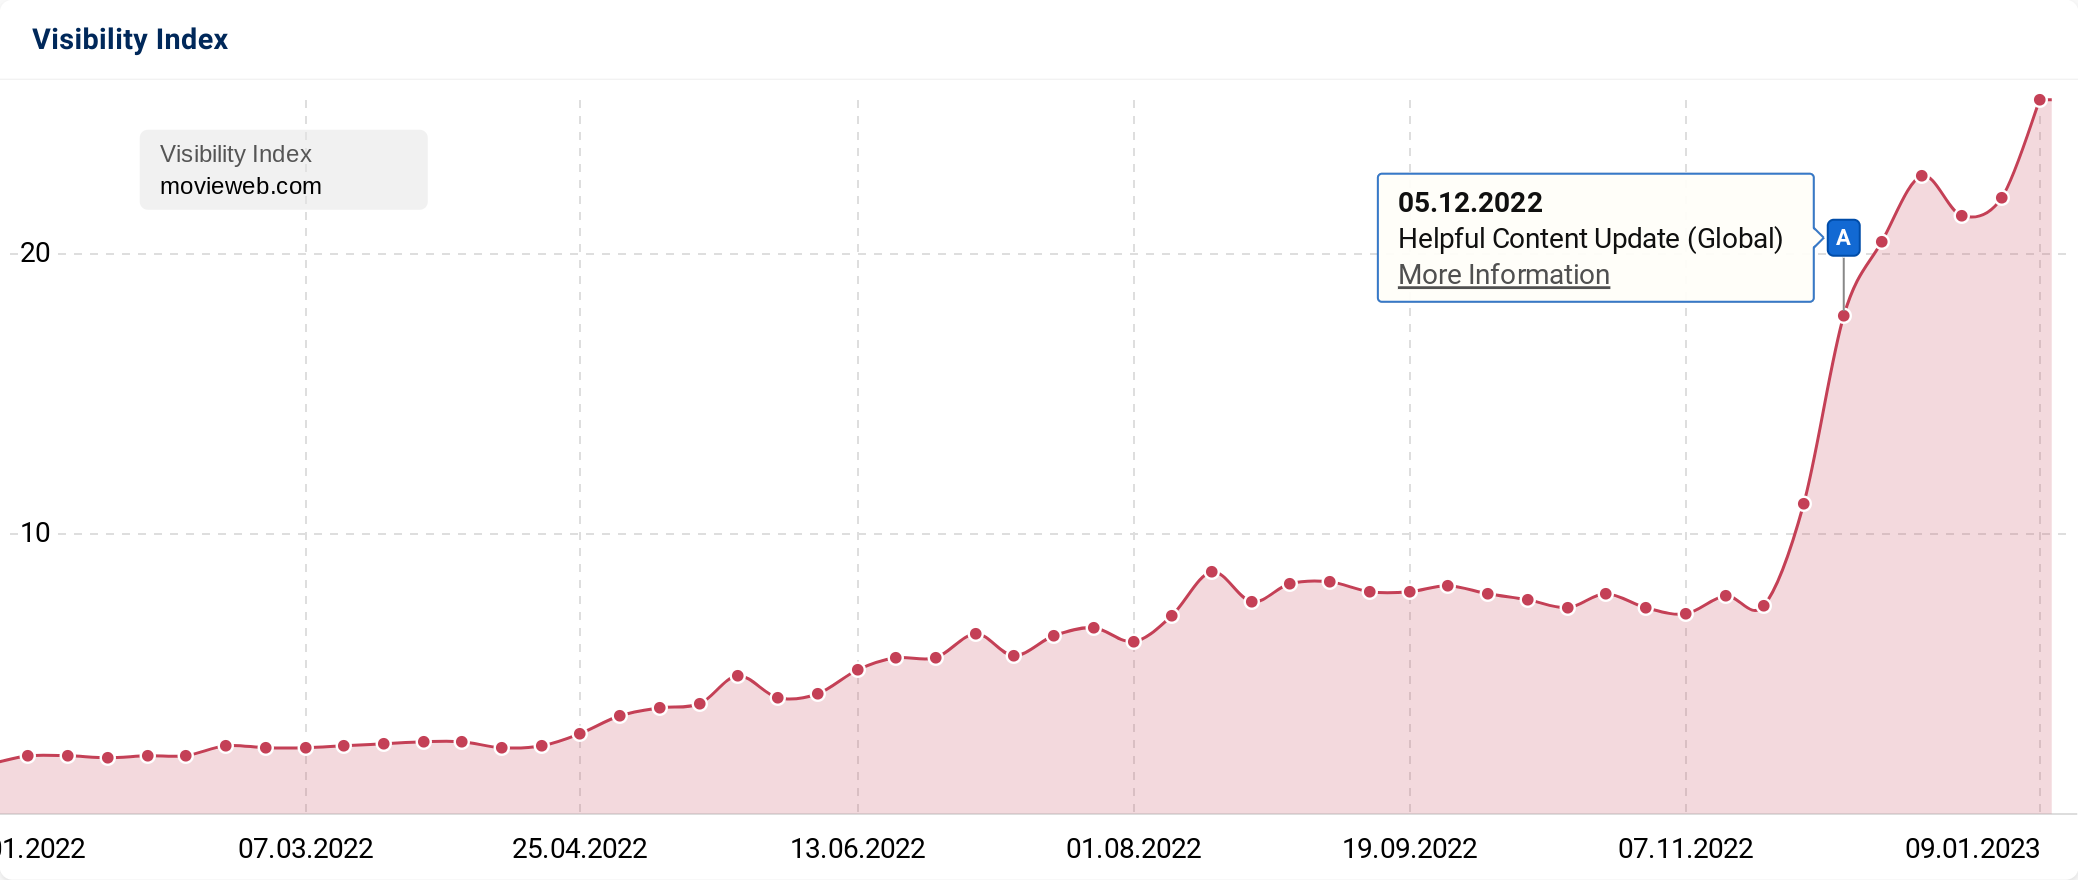
Movieweb.com is the biggest percentage winner among all the sites, with a percentage growth of 1,242%! Movieweb grew tremendously right around the time of the 2nd Helpful Content Update. However, it’s unlikely that the Helpful Content Update was directly responsible for the significant growth in visibility this site saw toward the end of 2022.
The reason for this is that the Helpful Content Update uses a negative ranking signal, which Google calls a “classifier,” which can bring down the rankings of the entire domain if the site is deemed as unhelpful by this ranking system. Because the classifier is a negative ranking signal and not a positive one, it’s unlikely that such an uptick in visibility would occur as the result of this update.
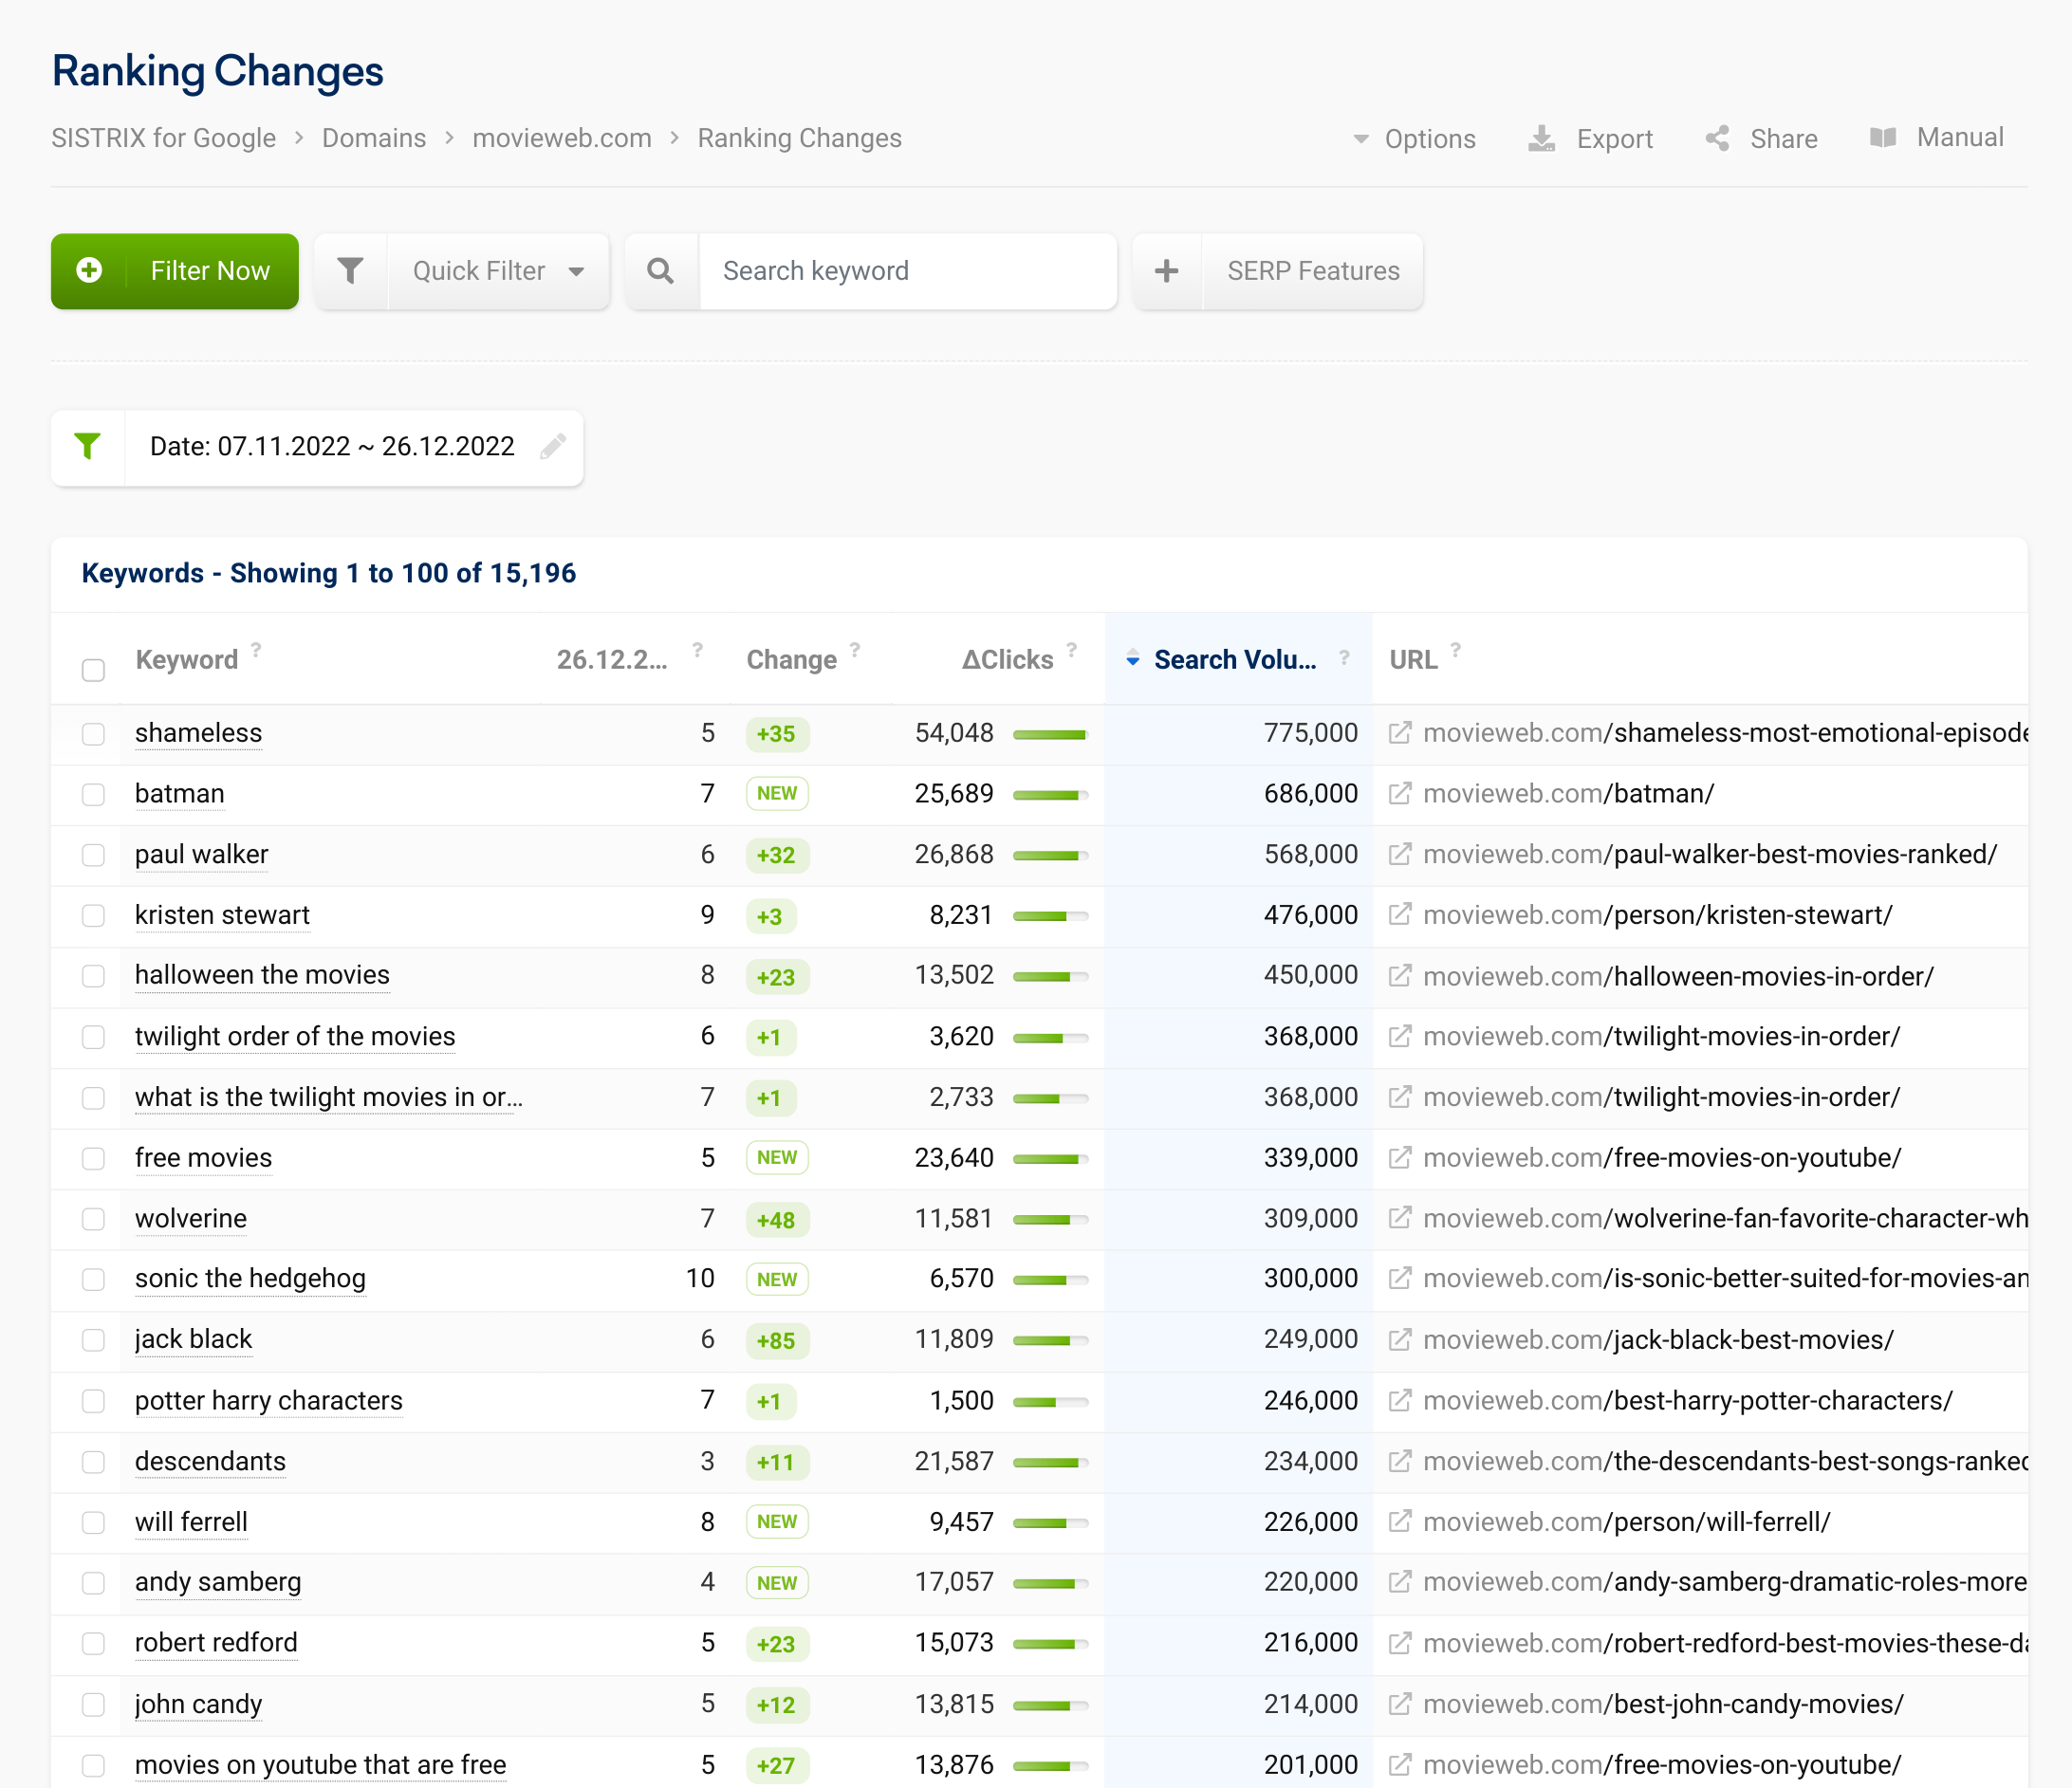
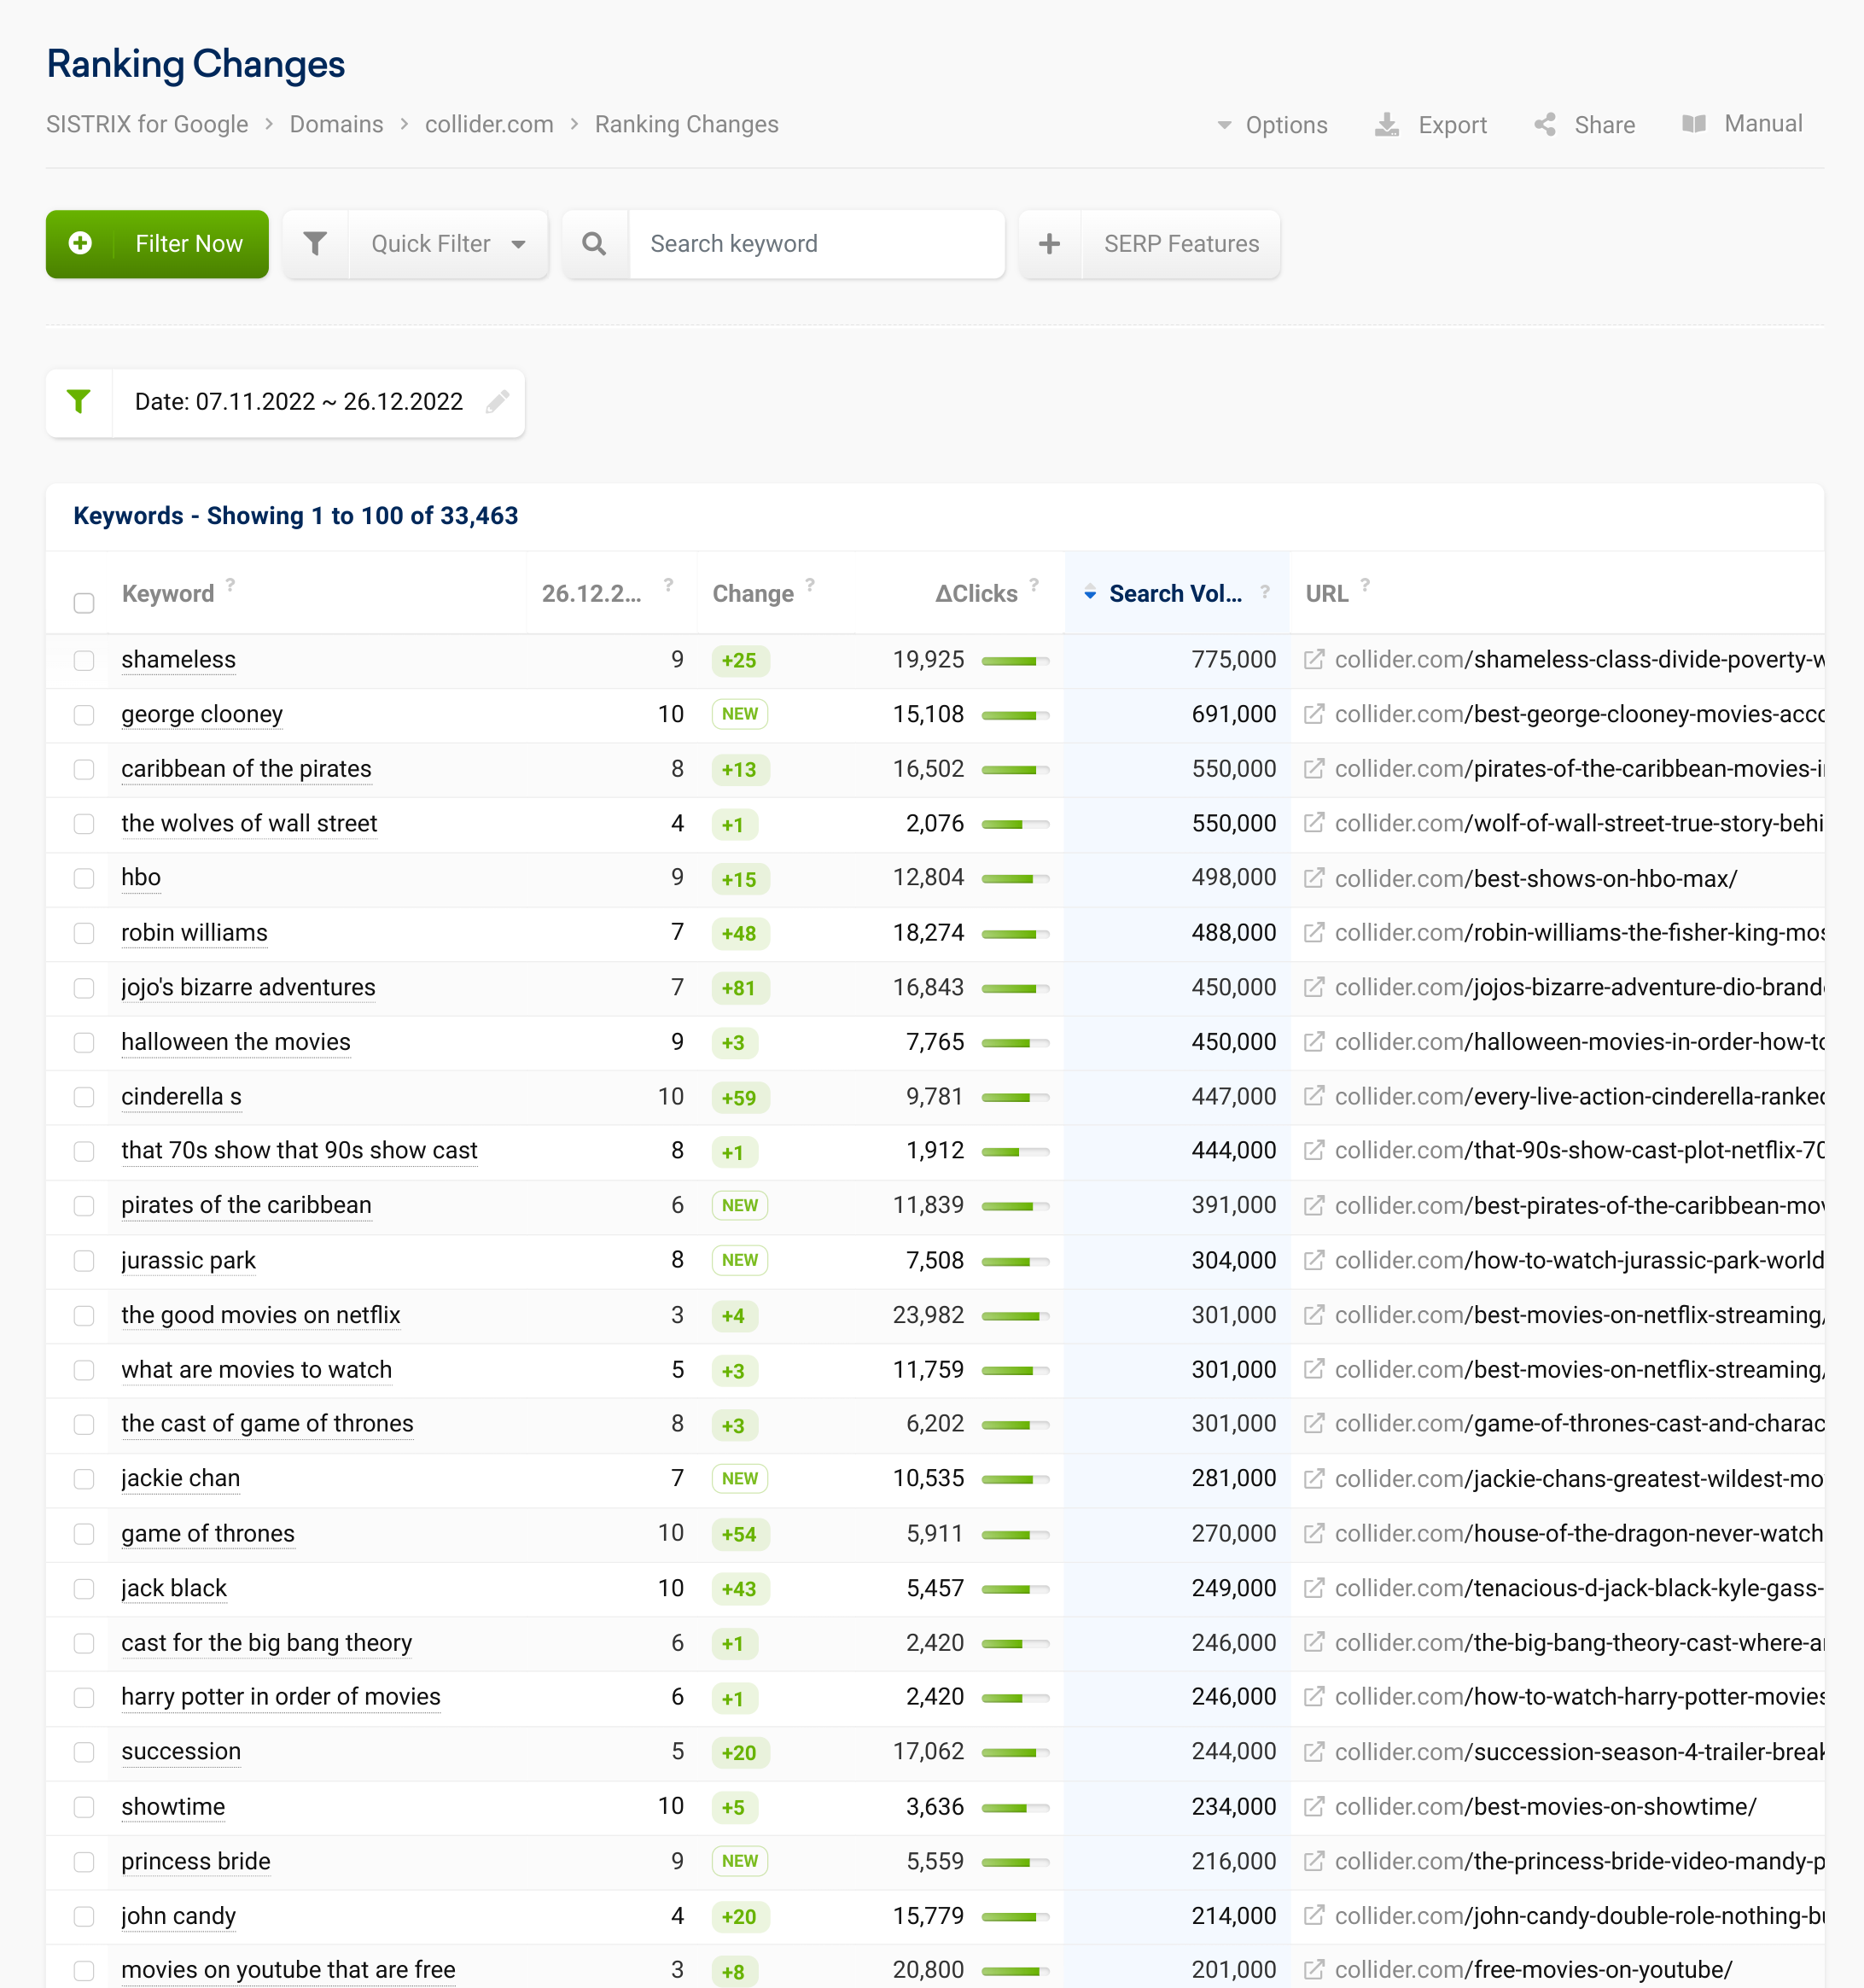
That said, the ranking increases seen by Movieweb are significant, with many high-volume celebrity and entertainment keywords moving up, or onto page 1 between November and December 2022.This is what is primarily what is causing the huge uptick in visibility.
The site has both tag pages and many different article pages related to the celebrities and other entities they write about, which appear to earn top 10 rankings.
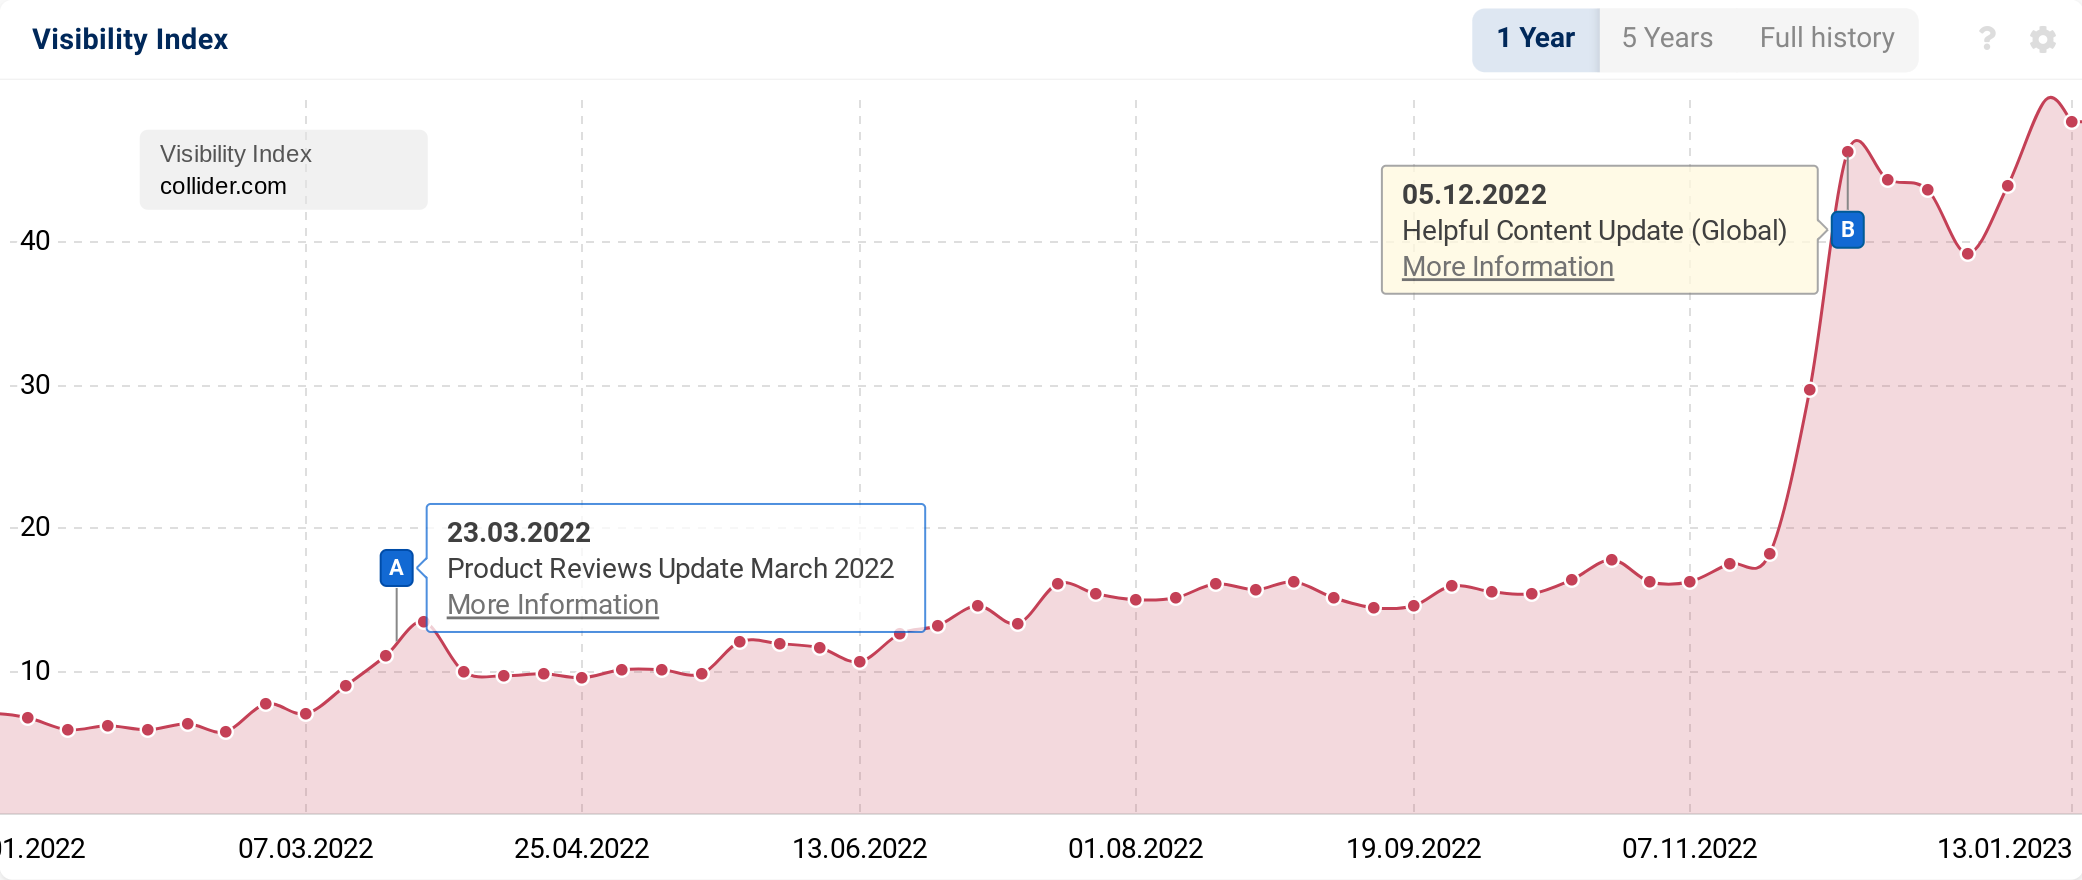
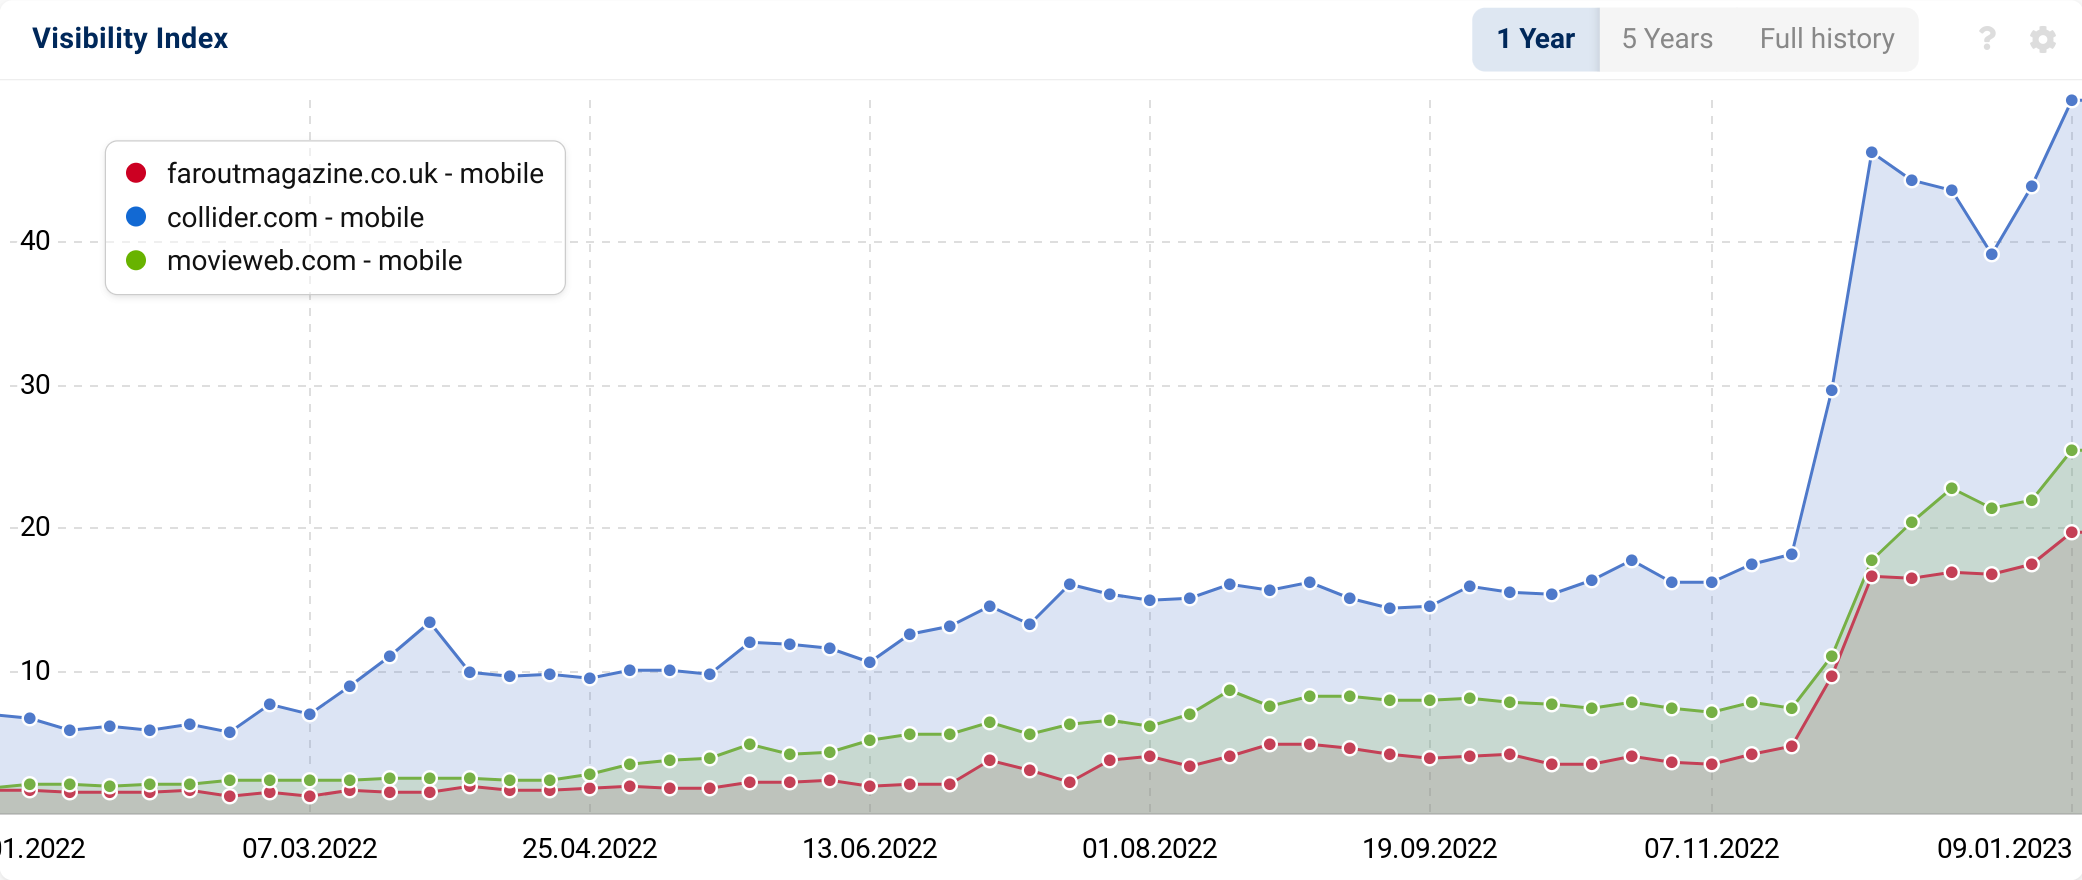
The entertainment site collider.com saw a nearly identical visibility pattern, with a massive uptick in keyword rankings around early December 2022.
Looking at the keywords that increased to, or within page 1 during this timeframe, the pattern is very similar to that of Movieweb. Collider earned top positions for many high-volume celebrity and entertainment queries, with many moving from positions 30+ or not ranking at all, to positions 1-7.
Interestingly, another entertainment publisher site, Faroutmagazine.co.uk, also saw a similar visibility increase around the same time as Collider and Movieweb.com. Here are the three domains gaining visibility at around the same time in late 2022.
Large eCommerce players
- amazon.com (+864.13)
- ebay.com (+230.23)
- walmart.com (+160.84)
- etsy.com (+110.81)
- homedepot.com (+60.84)
- bestbuy.com (+50.21)
- target.com (+47.97)
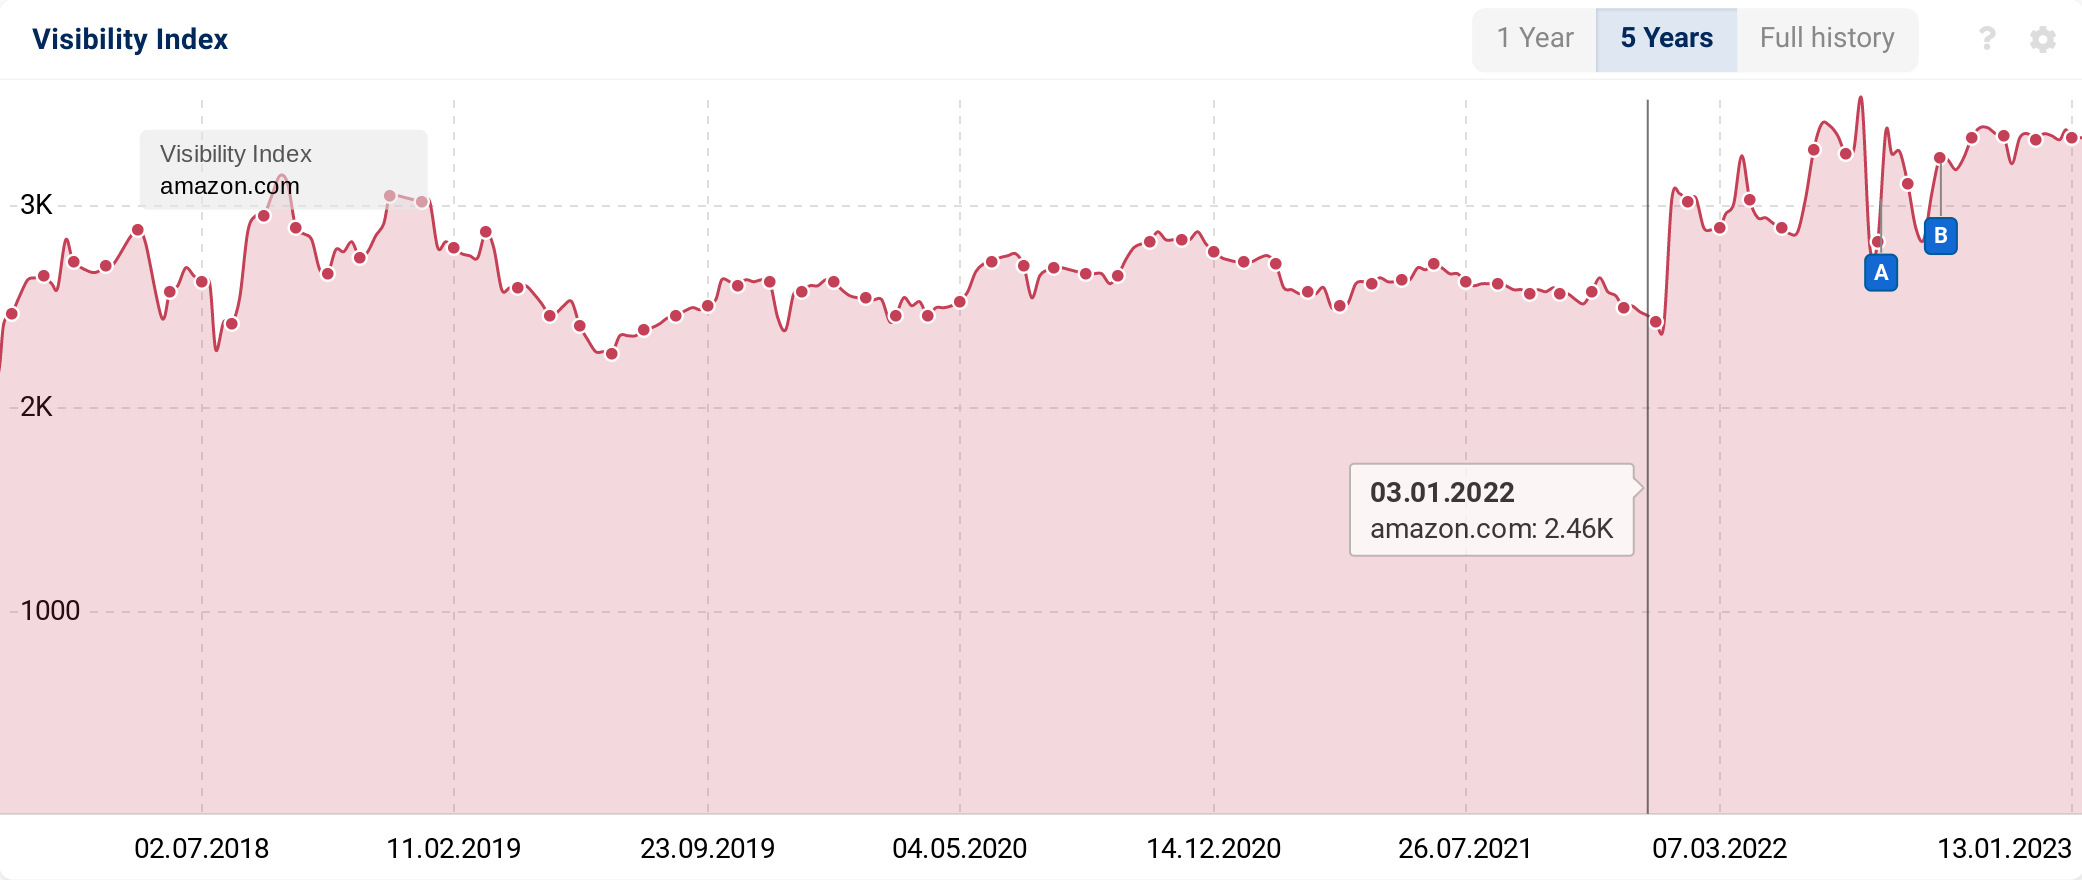
Amazon, the 3rd biggest winner of absolute visibility index points, saw a significant uptick in visibility on January 16, 2022, and then a gradual growth throughout the course of the year. Two of Google’s Product Reviews Updates are shown as annotations ‘A’ and ‘B’ in the below chart. Google’s Product Reviews Updates updates have occasionally resulted in eCommerce sites earning top positions from product review sites negatively impacted by the updates, which may have contributed to those visibility spikes for Amazon.
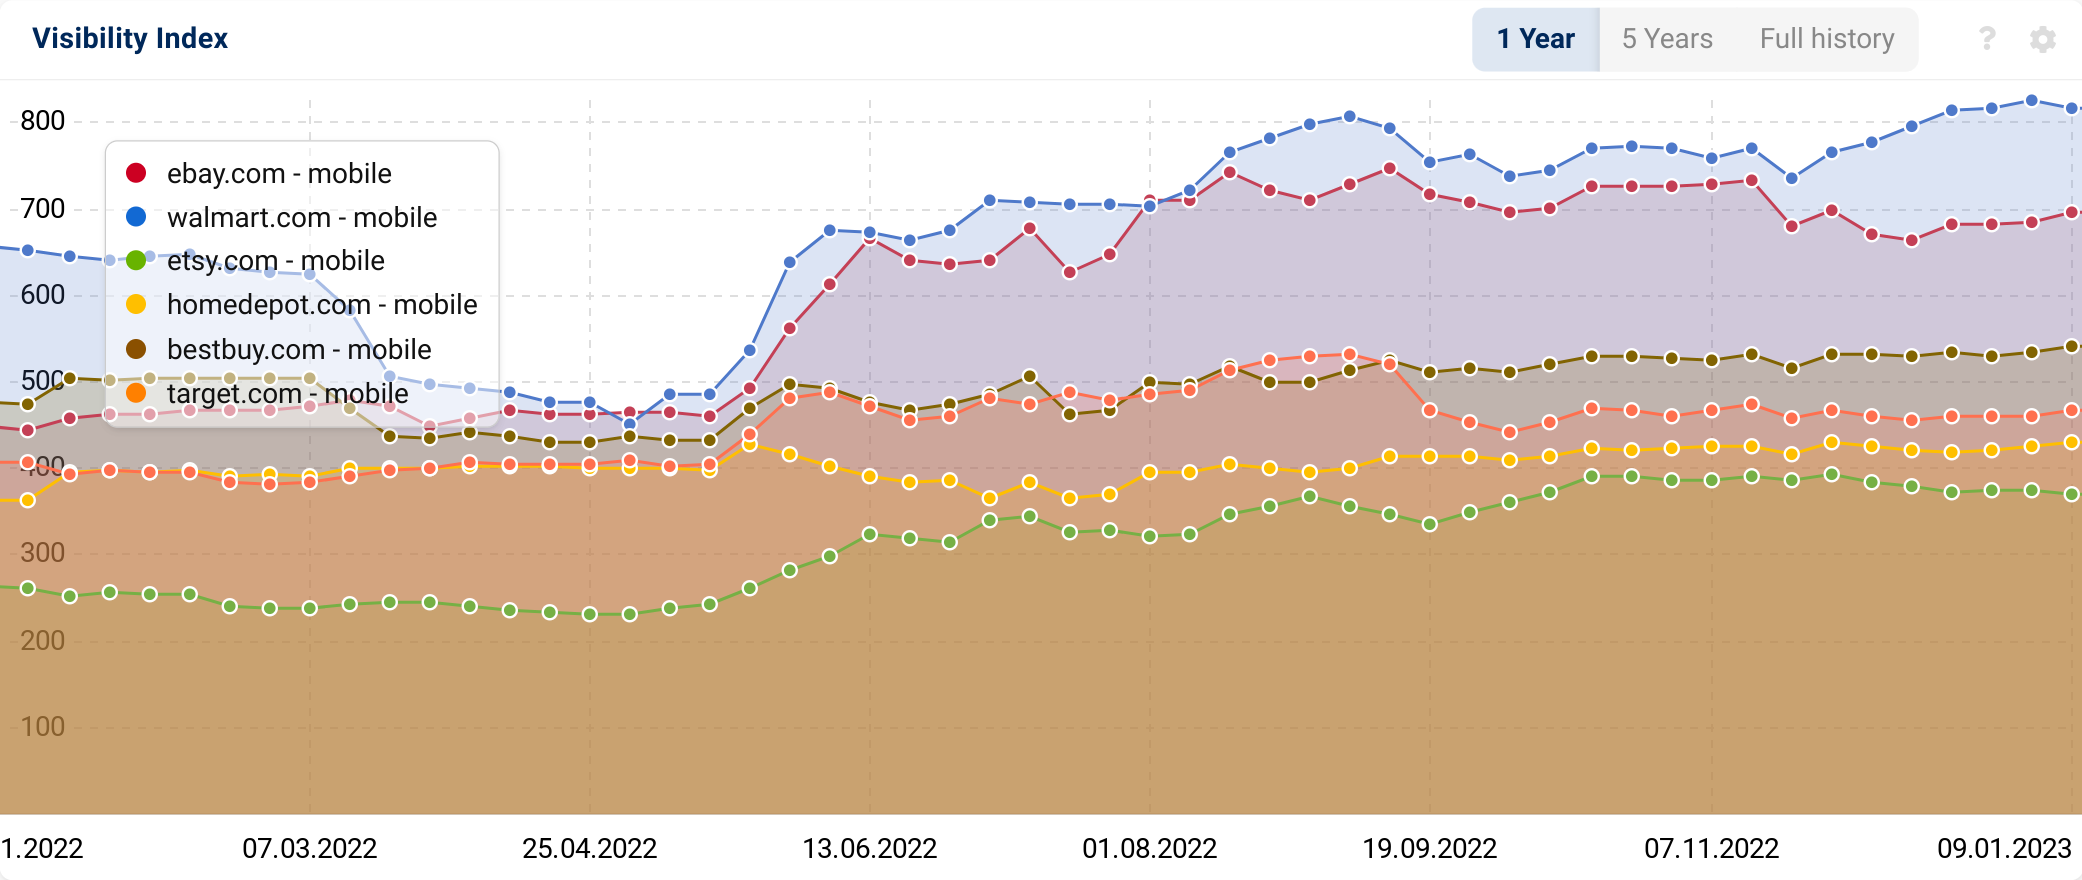
Below is a view of how 6 of the top ecommerce sites fared in visibility throughout the course of 2022. The letter “A” represents the May Core Update, when Ebay.com, Walmart.com, Etsy.com, Bestbuy.com and Target.com all saw significant increases.
Dictionary sites
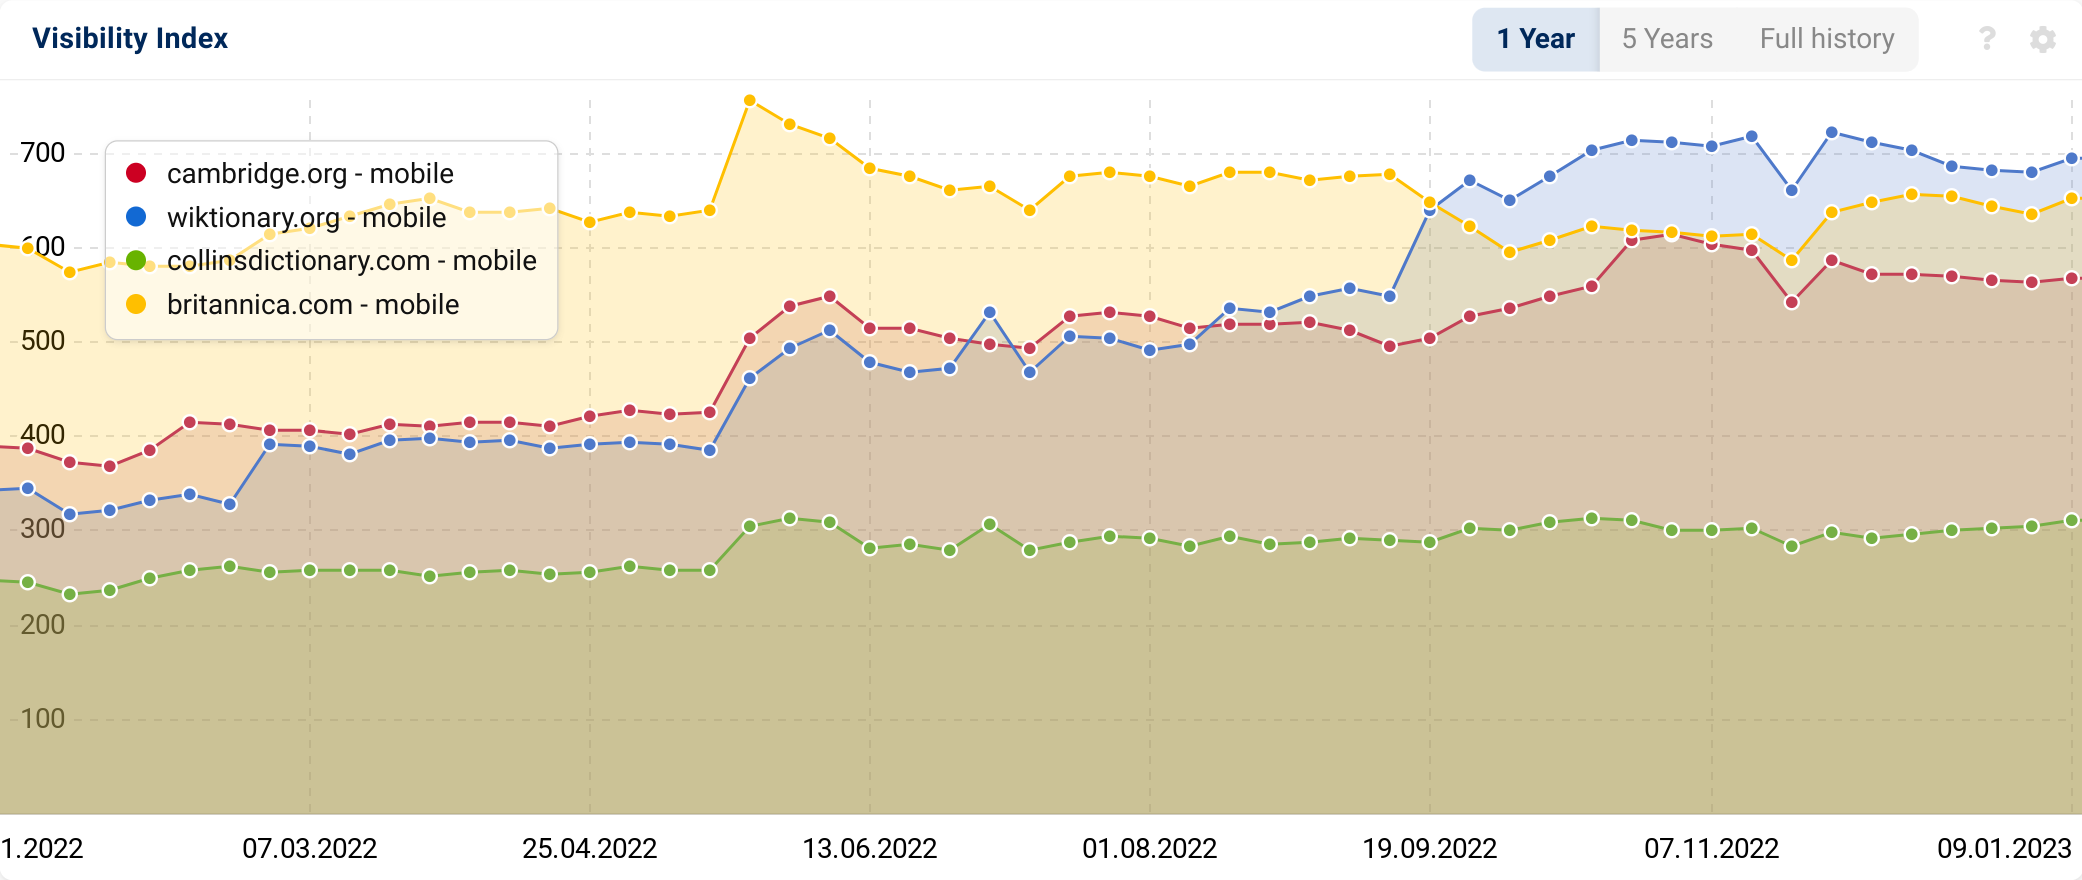
- cambridge.org (+167.09)
- wiktionary.org (+341.33)
- collinsdictionary.com (+49.03)
- britannica.com (+24.50)
Some dictionary sites saw big gains this year, and the winners all appeared to see a visibility increase in mid-May. Dictionary sites can often see performance increases due to intent shifts; if Google determines a certain query should return a dictionary result (whereas a different type of result previously ranked), this can lead to better rankings for Dictionary sites.
Product Review Sites
2022 was a tumultuous year for sites in the product reviews space, with 3 new updates to Google’s Product Reviews ranking system.
For some product review sites or sites containing product reviews, these updates did contribute to greater visibility throughout the course of the year, such as:
- rtings.com (+20.58)
- reviewed.com (+7.09)
- forbes (contains the subfolder Forbes Advisor) (+74.53)
- wired.com (+18.46)
Music Sites
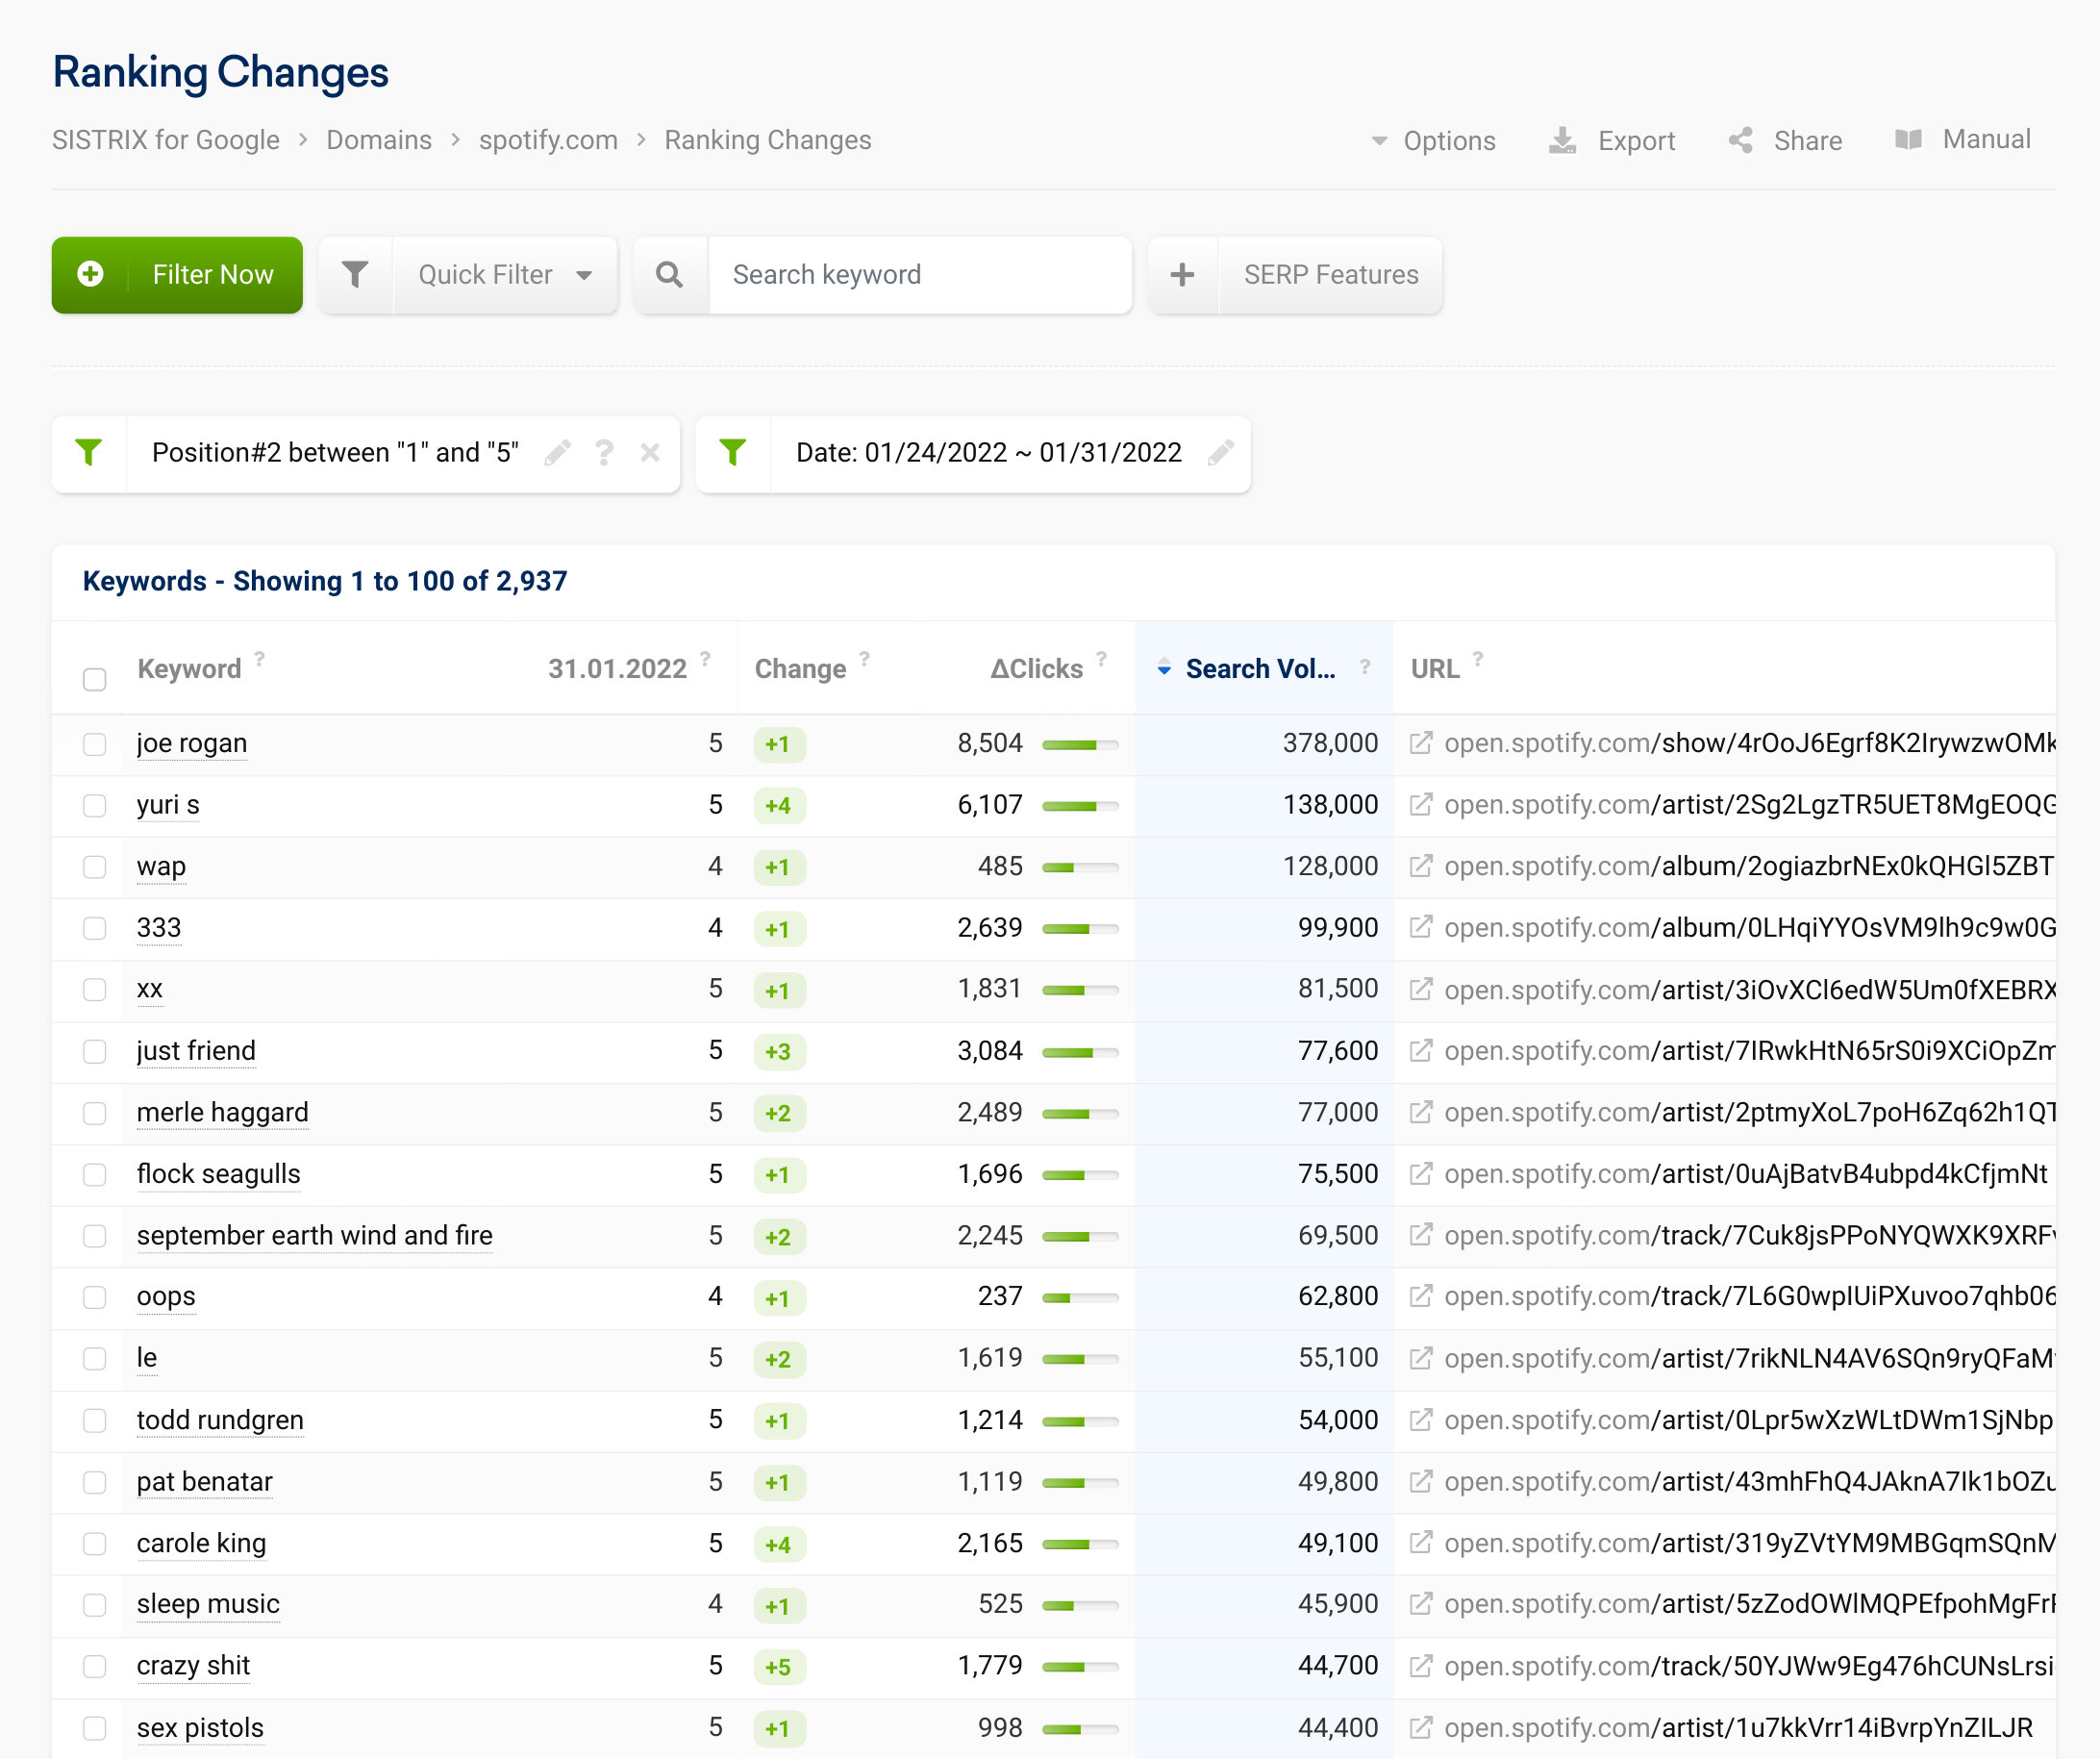
Several major music websites saw big growth in 2022, including Spotify (+79.11), last.fm (+32.29), and genius.com (+62.05). The September 2022 core update caused many music sites to see visibility increases, which may have led to some of these gains.
Below are some examples of high-volume, music-related keywords for which Spotify has earned top positions (1-5) in 2022:
Other music sites seeing big increases include lyrics and music reference sites like genius.com (+62.05), americansongwriter.com (+8.19) and last.fm (+32.29)
Forbes’ Big Year
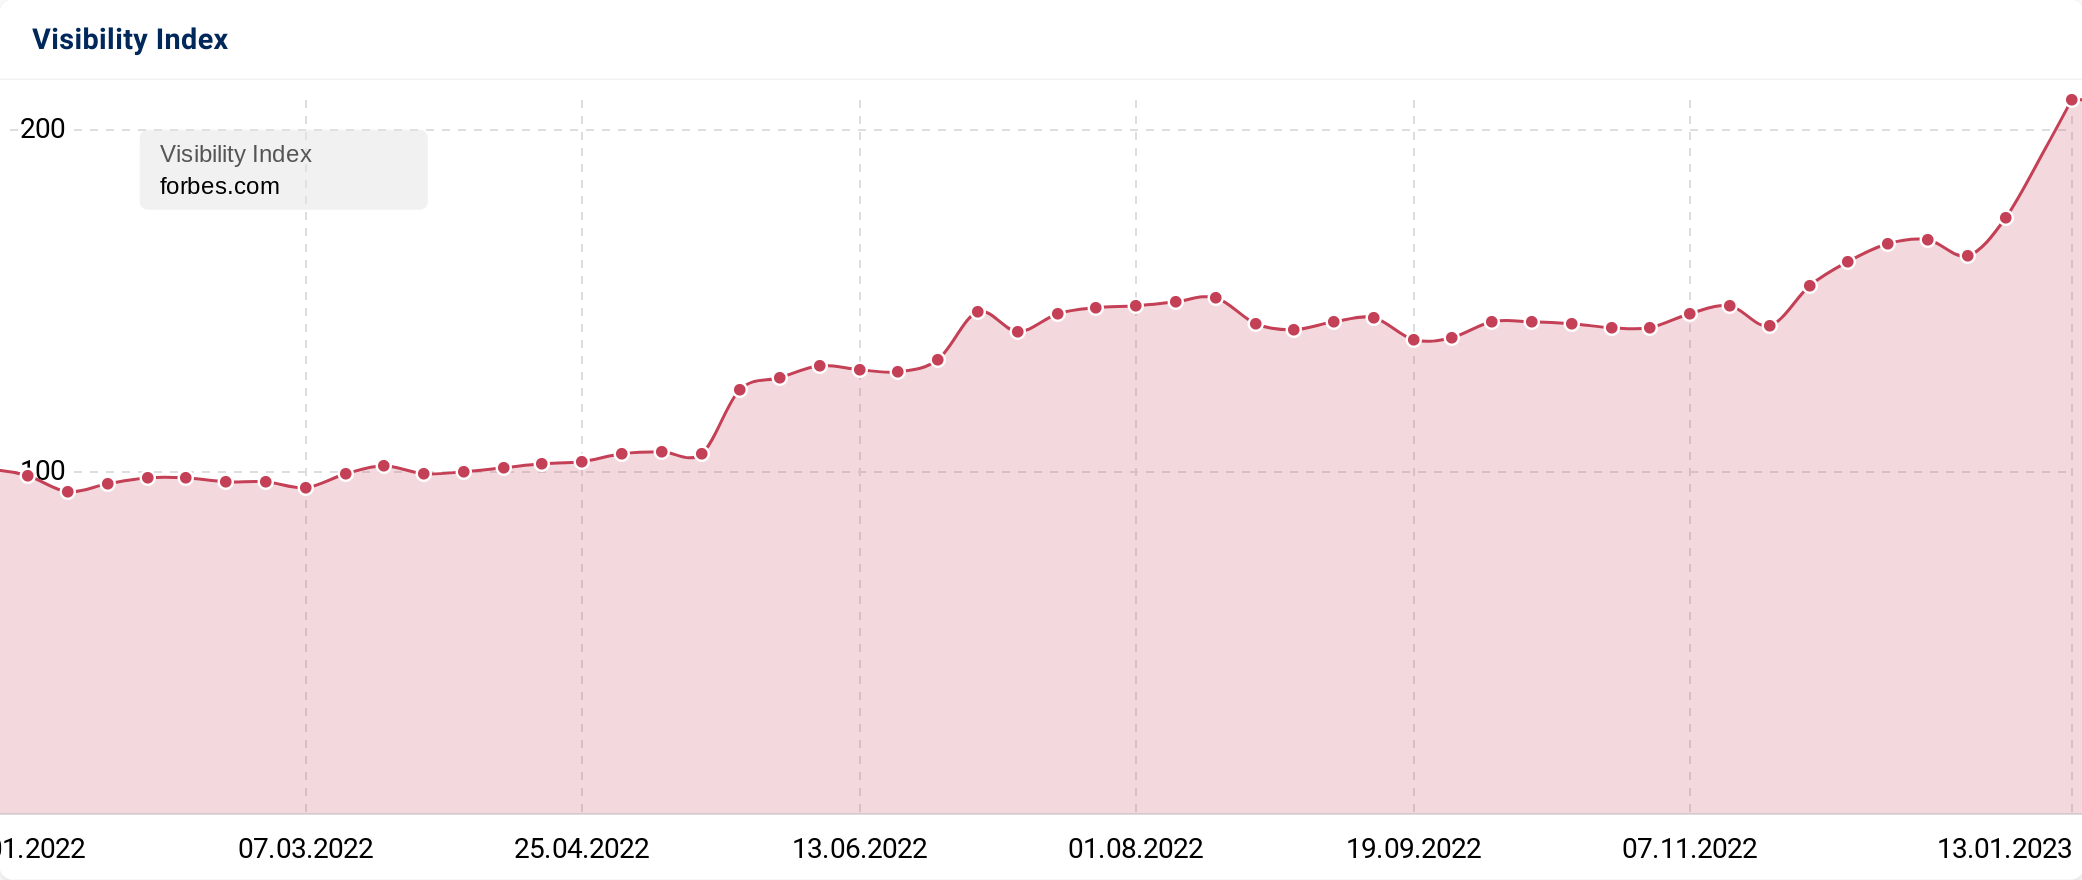
Forbes saw massive growth in 2022, earning 74.53 additional visibility points throughout the course of the year. Forbes had been negatively impacted by the November Core Update of 2021, but has regained the lost visibility and then some in 2022.
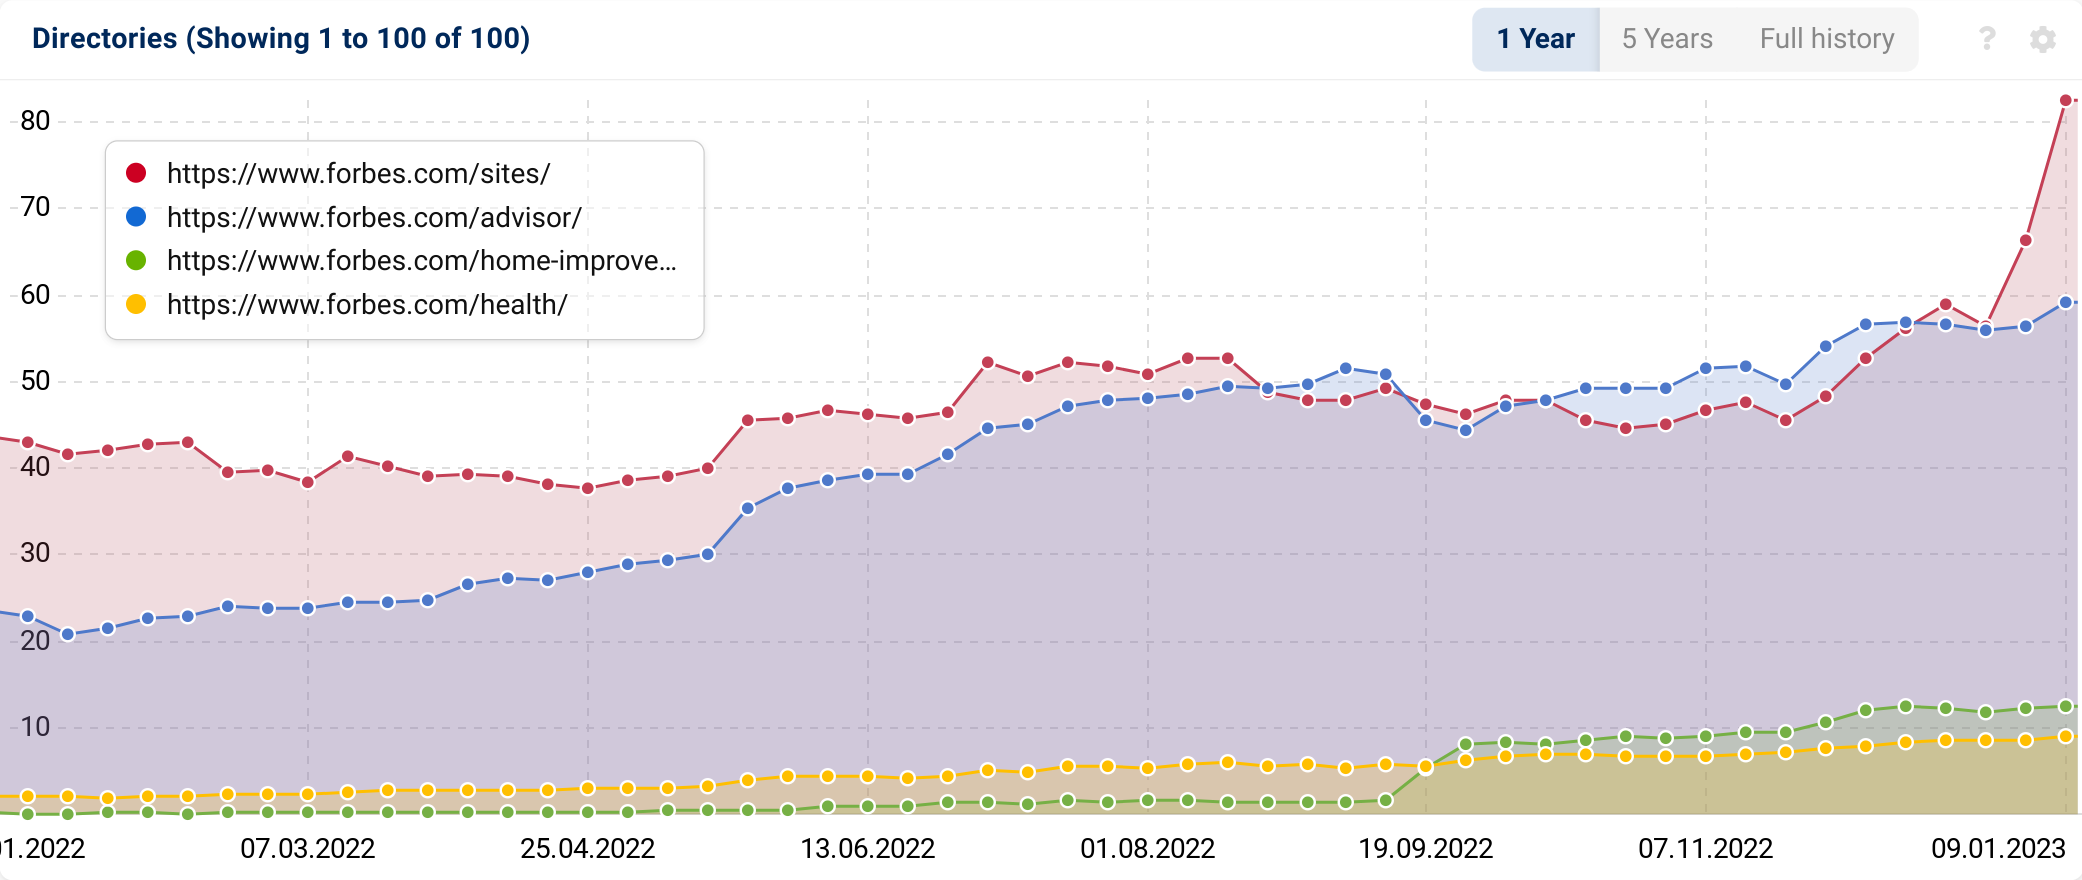
By looking at the directories on Forbes.com, one can see that the growth in visibility largely stemmed from Forbes Advisor, a subfolder dedicated to rating financial products and services. This growth is impressive, especially given Google’s increasing scrutiny over sites with product reviews.
The Athletic
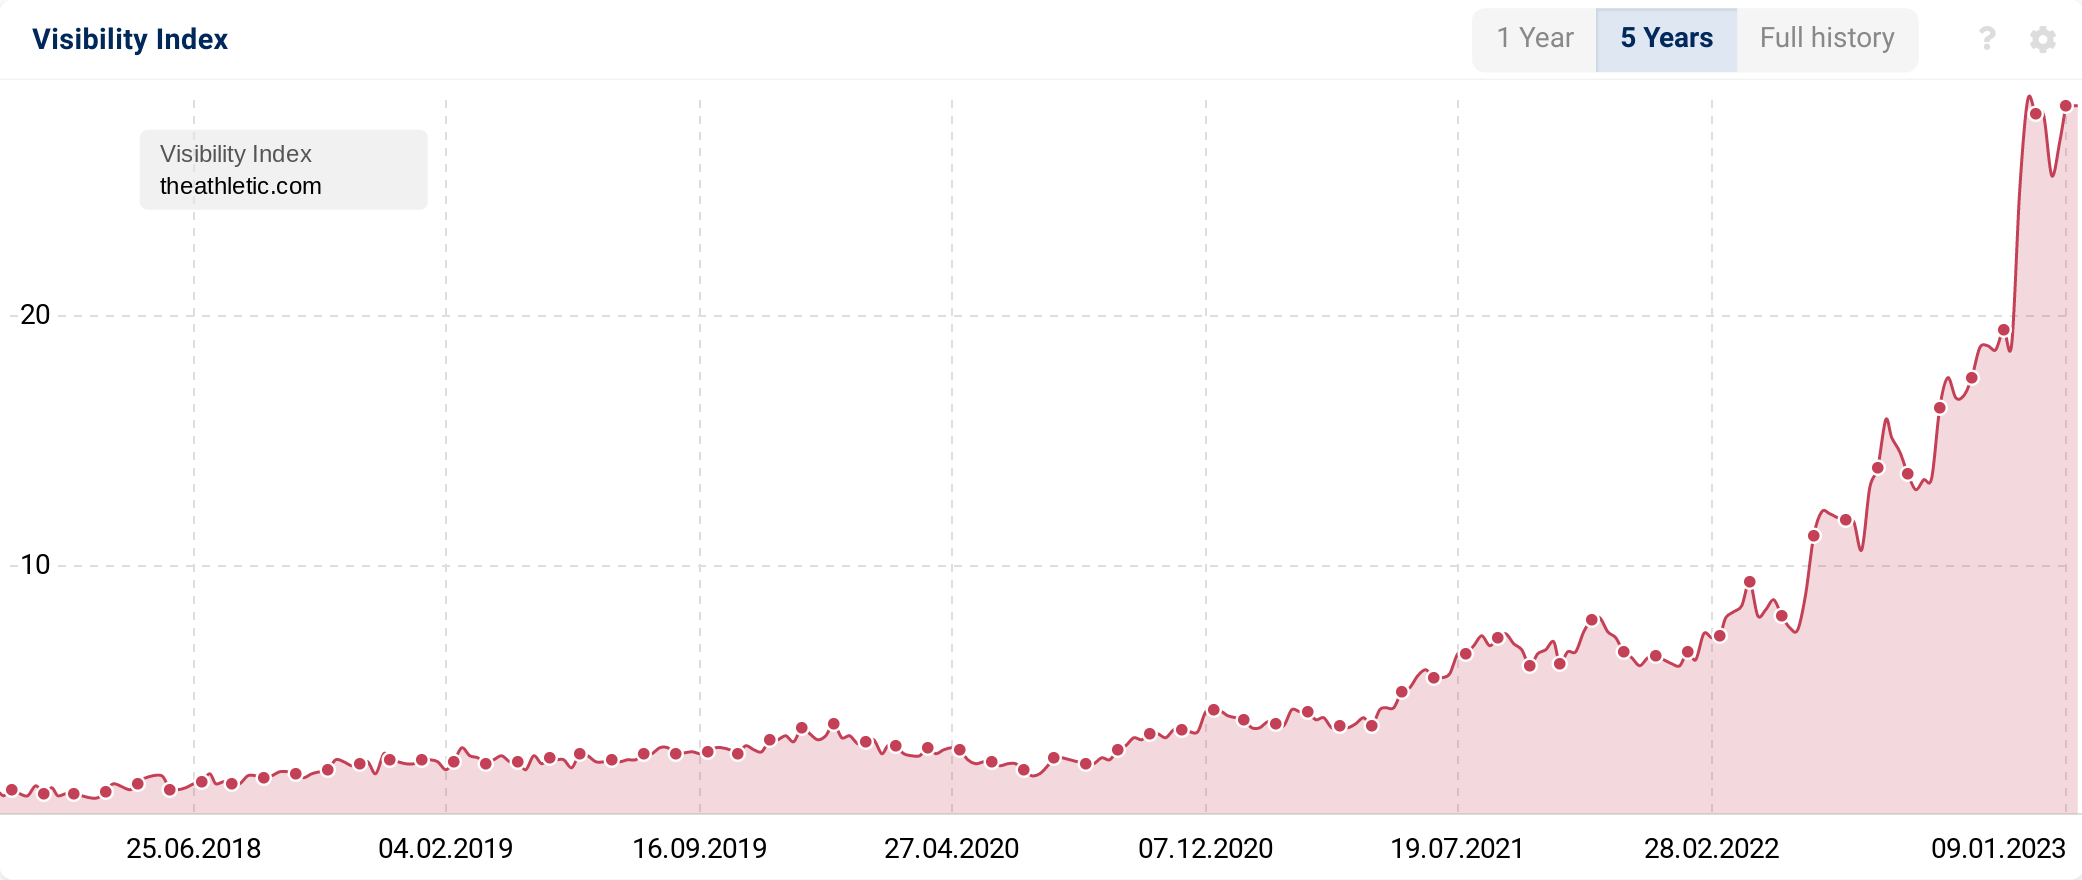
Another publisher site showing tremendous SEO growth is the sports news website theathletic.com (+20.75), which ramped up its SEO capabilities after being acquired by the New York Times in January 2022.
Bankrate & Other Finance Sites
Several sites in the banking, credit card, and financial space saw significant gains throughout 2022, such as:
- Bankrate.com (+15.43)
- Nerdwallet.com (+23.08)
- Lendingtree.com (+15.61)
- Seekingalpha.com (+8.23)
Bankrate.com saw consistent growth throughout the year, which appears to have been exacerbated by the May 2022 core update.
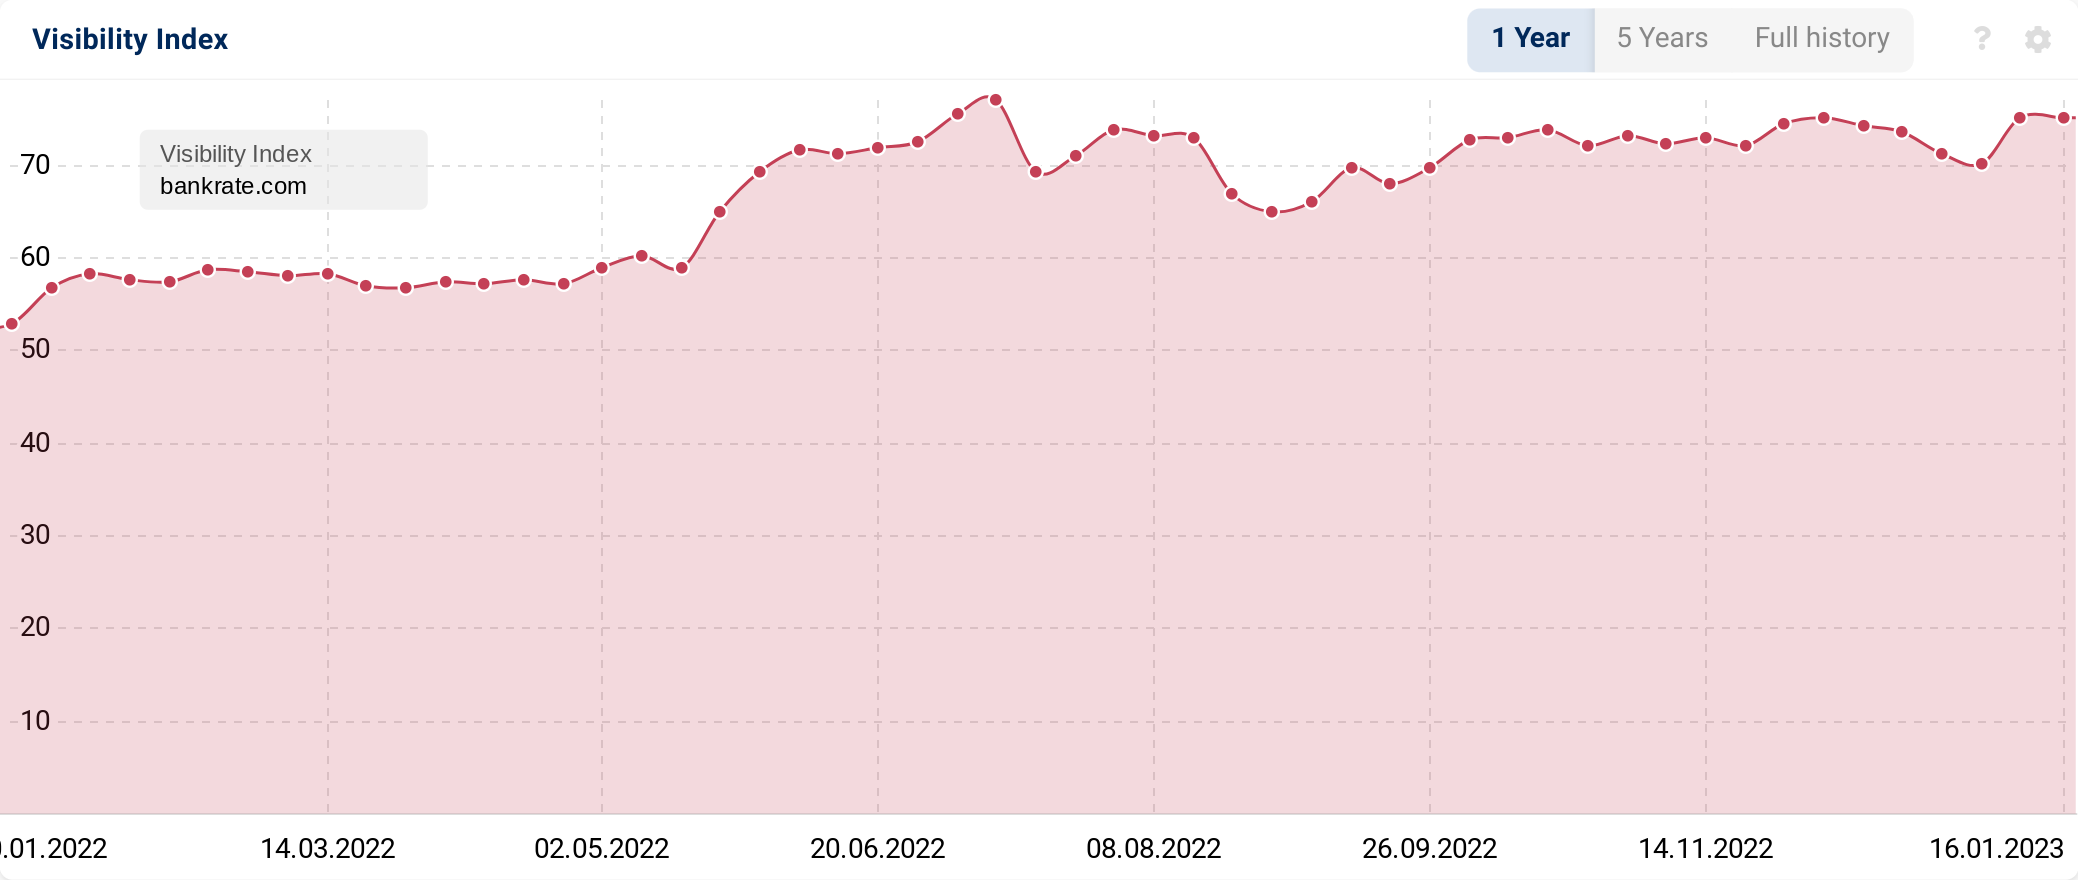
In an interesting turn of events, it was discovered in early 2023 that Bankrate is actually leveraging AI to generate much of its content, and is seeing strong SEO performance as a result of this strategy. Google even responded to the company’s use of AI content, by saying there is nothing intrinsically wrong with using AI content, but their bigger concern is with content written primarily for search engines, not human users.
Social Media Sites & Inventory growth
As with previous years, some sites make the top winners list in large part because of the growth of the number of pages added to their sites, whether by an increased user base or new products being added. While many other factors contribute to the growth of these sites, it’s important to consider the growth in the number of indexed pages as a big contributor to visibility increases.
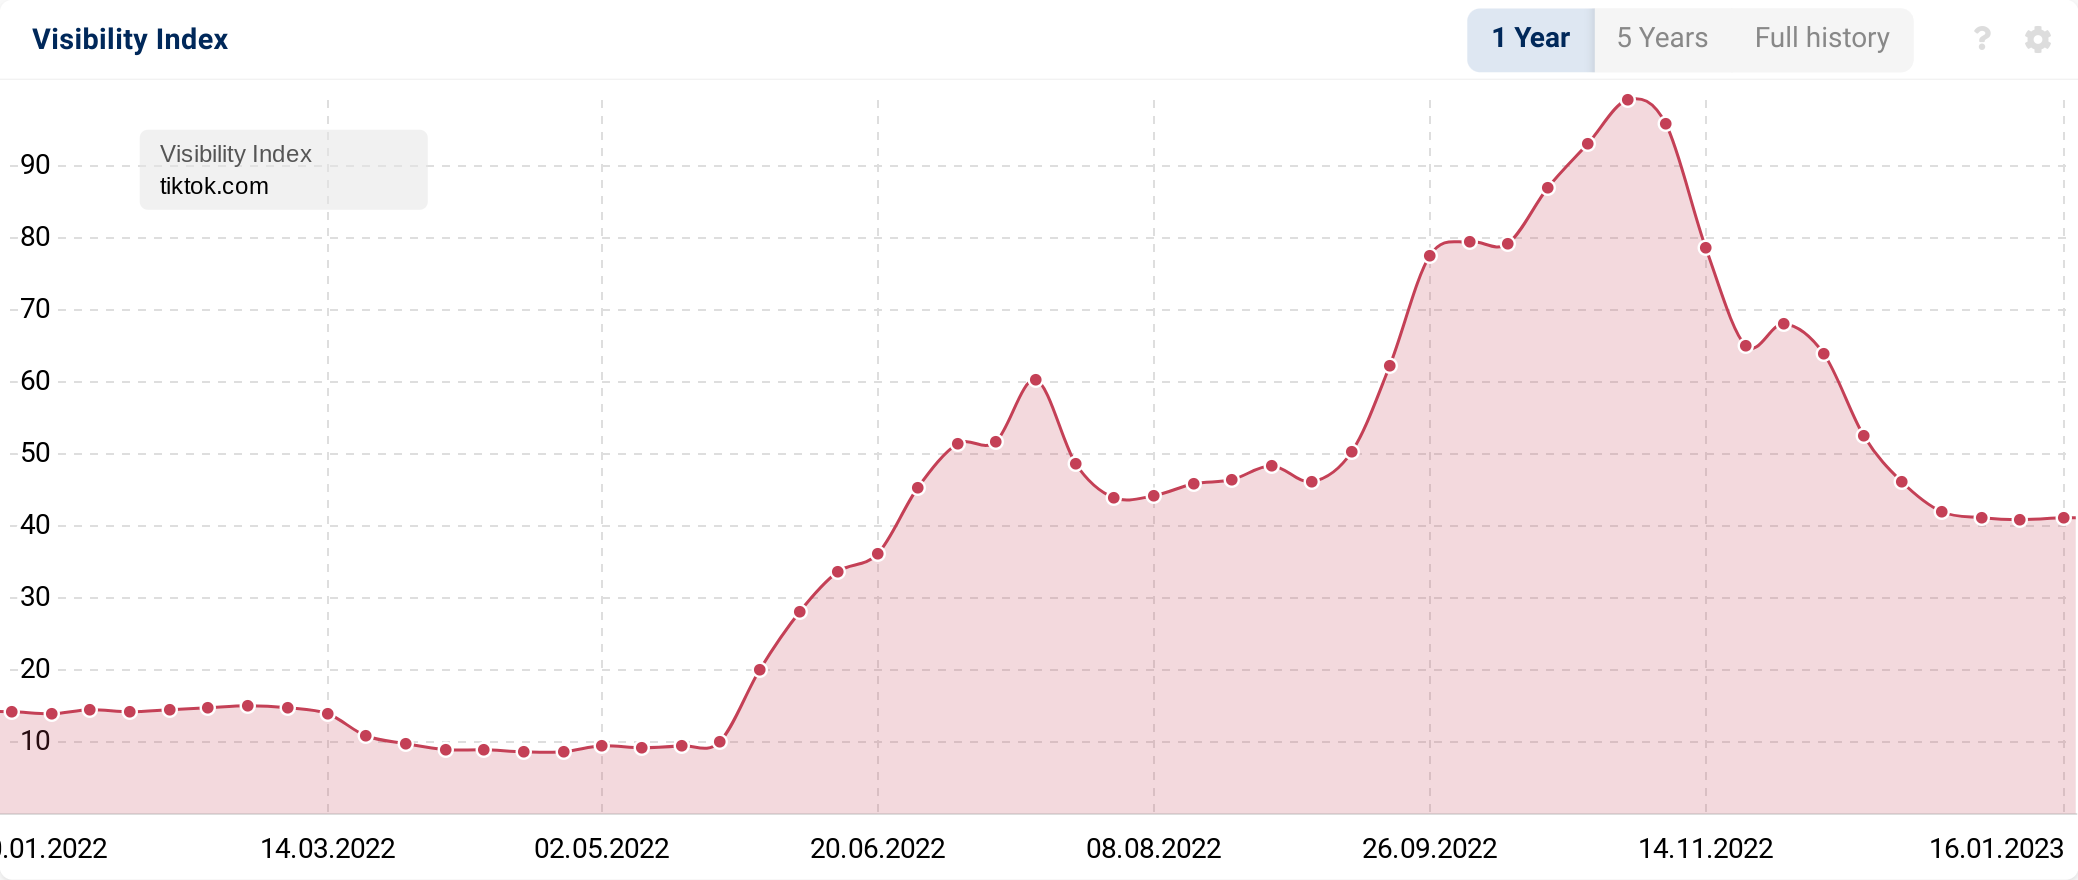
Sites that likely fall into this category are social media sites like instagram.com (+109), facebook.com (+103.59) tiktok.com (+27.43), and pinterest.com (+103.91).
TikTok’s organic performance on Google was a bit tumultuous, with a massive increase in visibility after the May 2022 core update, but visibility rapidly declining toward the end of the year.
Conclusion
While many factors and many Google updates affect visibility of these sites, these winners likely benefited from some combination of a strong SEO foundation, a growth in indexed pages, world events, or shifting search intent that led Google to ranking their sites more prominently.
With the rise of AI content and other big SEO trends kicking off 2023, it will be fascinating to see which sites are winners this year.
Other IndexWatch studies include UK, DE, ES, IT and FR
The 2022 IndexWatch report is available for the following countries:
🇩🇪 Germany
🇮🇹 Italy
🇪🇸 Spain
🇫🇷 France
All our current and past IndexWatch (UK and US) analyses are available here, including an analysis of the US data. You’ll also find the UK and US losers as soon as they become available.


